Market Internals
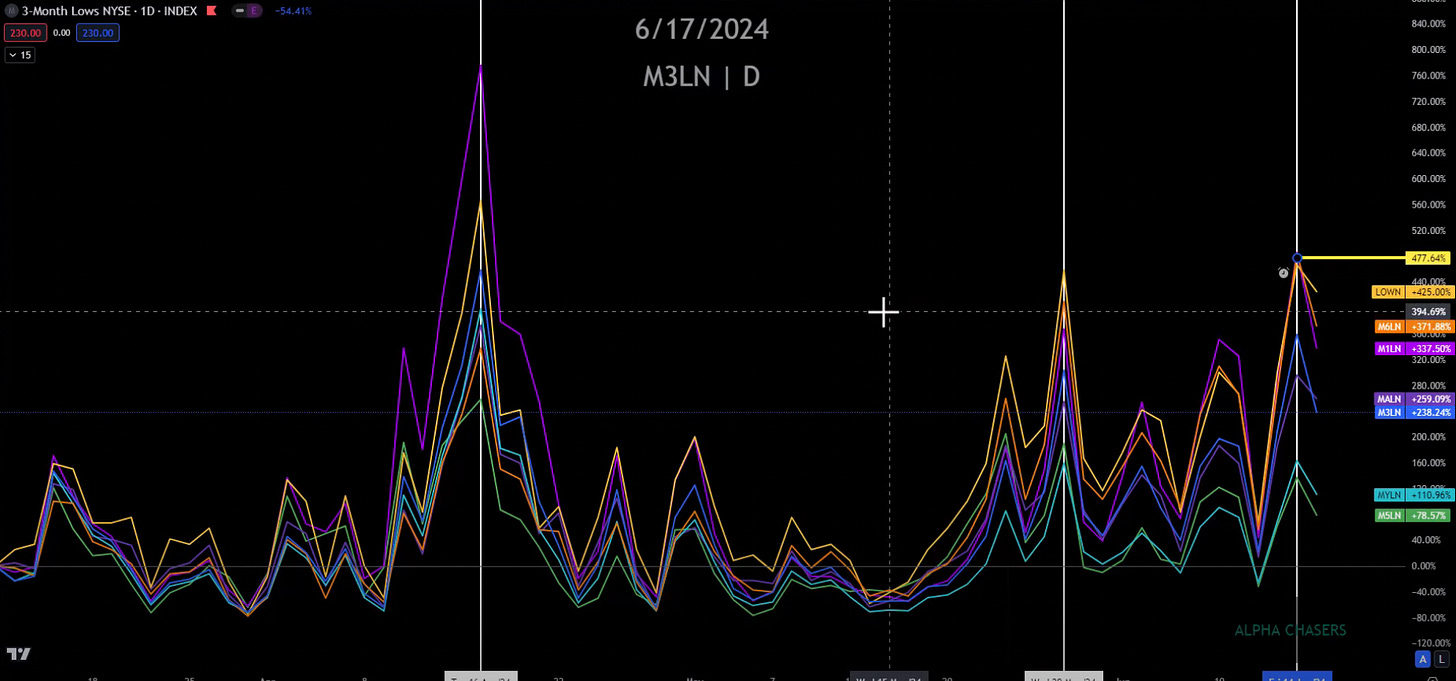
One indicator I have been using recently is one that I created which tells us the percent of stocks at three month lows.
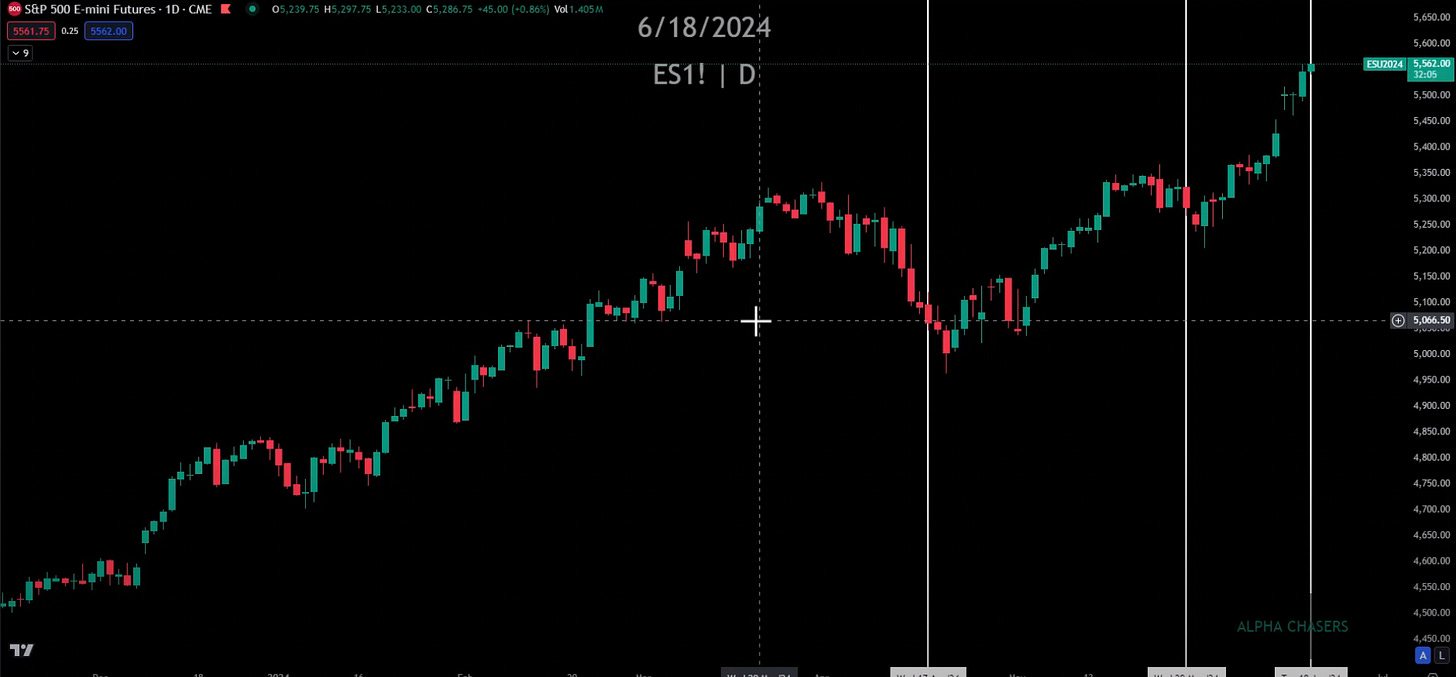
The way that I use the indicator is when we see peaks, it tends to correlate with bottoms in the market. In other words, when three month lows reaches a top and starts reversing, that typically signals a reversal in the market.
You can see the peaks recently here:
And this is where those peaks correspond to on the ES:
You can see that it isn’t 100% perfect but within a few days it has called reversals. You can see that we hit a peak in our last trading day. Even though we are at all-time highs, we may still have room to run.
If you’d like access to this indicator just let me know, I am happy to share it.
I often look at S5TW (below) - stocks above the 20-day moving average.
You can see very defined highs and lows which can help you understand where we might be going once we hit an extreme reading.
Right now we are sitting in the middle - but what that signifies is that we are not at a peak yet and there is room for the market to push.
Watch this video for more analysis of how I think the market is going to perform in the short-term:


