We are back baby! We have been waiting for confirmation of the March 7th low and today we have that confirmation. I mentioned in yesterday’s video that we were setting up to break out and that is exactly what happened. The $QQQ closed at $325. This is straight through the 50-day moving average as well as the upper wedge line and $324 resistance. Making the higher high takes us out of defense and puts us back on offense. The Nasdaq has stabilized and flipped back into its bullish trend instead of the chop suey. This means that the accuracy of putting new trades on will increase dramatically. Expect to see new leaders emerge. Primarily it looks like the semiconductor equipment makers. $KLAC and $LRCX are both up $50 and $75 respectively from saturday’s stocks to buy YouTube video. Look for a rotation into other beaten-down sectors. One that shows promise is Biotech Index $IBB. This can be traded with $LABU as a 3x ETF. Also, expect the smaller caps to underperform as Institutions will now chase performance in the high beta names.
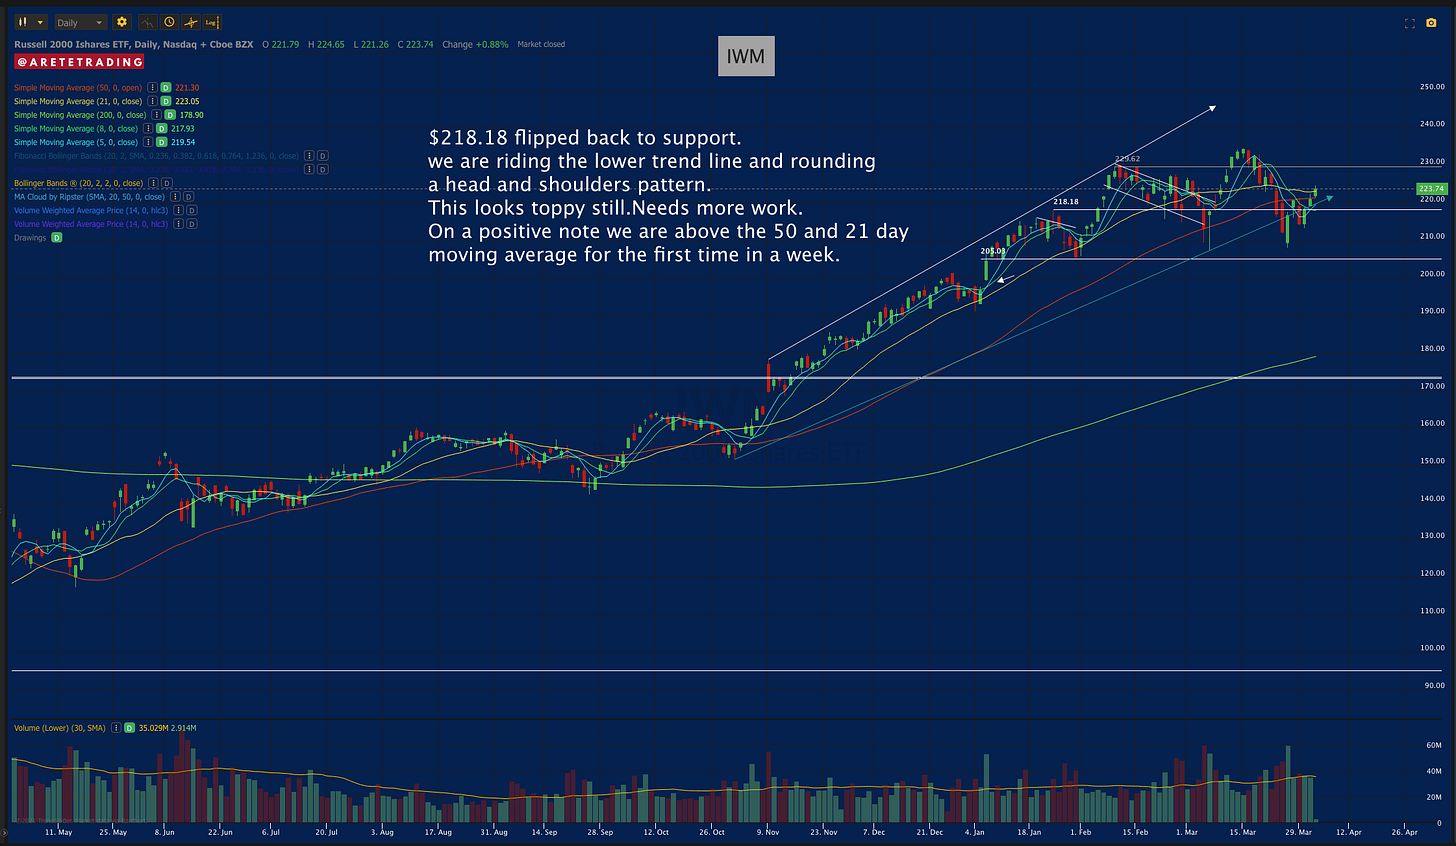
The $SPY made an all-time high closing today at $400.61. Note the upper trend line. We are getting close to the upper band approx 4% away from it. The $IWM looks toppy as is rising the lower trend line of the channel. We are above $218.18 and the 50 day moving average. This is progress but there is more work to be done on small caps before the all-clear signal.
Since the stock market is closed Friday. Sunday’s Newsletter will be about the indexes and sectors on a monthly overview as well as new stock selections. Everyone have a great holiday weekend!
let’s get to our indexes!
Let’s get to our stocks!
EXPECT MORE STOCKS ADDED SUNDAY
Subscribe to YouTube! 👈Subscribe and turn on notifications. The stock to buy this week's videos is doing very well. I also am starting a series “Trade like a Pro” where I give a quick, simple and easy-to-understand explanation of stock market indicators and how to use them.
As always all investment decisions need to be made by the individual. We all have different risk profiles.No two people trade the same. Understand the buy points, stop losses, trims are suggestions. For example on stops. I want to see it close there at the end of the day.
You need to develop your own process. I am willing to help and offer feedback.
Please make sure you Subscribe to Twitter! 👈and turn on notifications. There are times my updates are timely in regard to the Newsletter. I called key levels on the $LRCX
and $MU buys today.
Any questions please message me.
Thank you again for all the messages telling me how this Newsletter improved your performance and made you a better trader!
Wishing everyone Massive success!
Now you can share the Newsletter!
👇👇👇
Subscribe below!
👇👇👇


I jumped in the NVDA alert yesterday; small position at ~542. After it ran, I moved up my stop. I see it needs to clear 555. My question is related to adding to a position. How do you decide when and where to add? When pulls back, when it clears another level or keep adding if it stays above the 5,8,21 SMA? It jumped through the 50 SMA. I put a trend line from 3/16/20 (180.68) and connected the tail at 3/8/21 (462.66), cloned it, it looks to me we are about in the middle above that trend line and in the channel. I’ve learned quite a bit from your videos! Thanks! I could not comment on the youtube page.
How do I send you a message? wondering how like trading view as a charting platform...