📈 Bear Patterns 2.0 (TIME SENSITIVE)
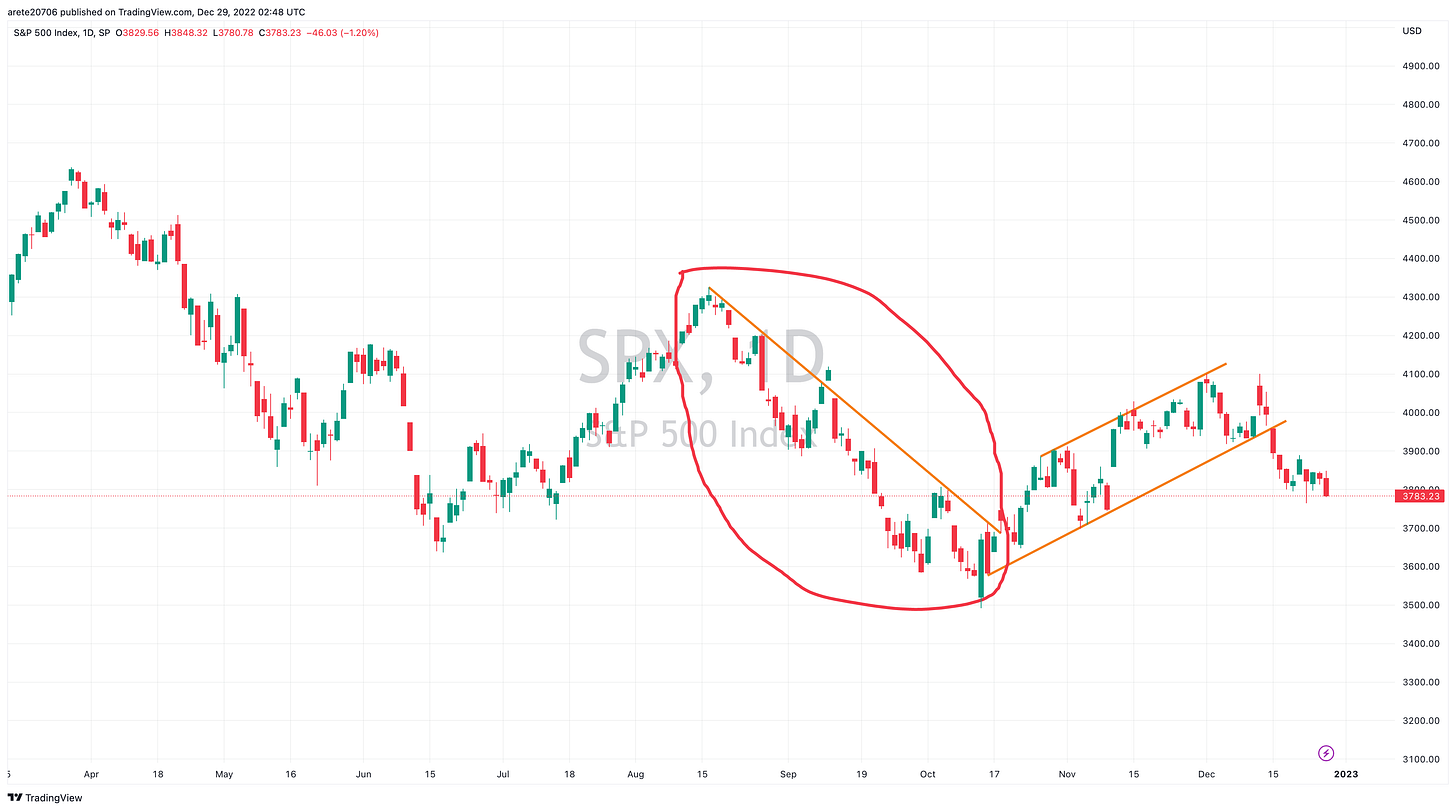
As we approach the 2023 we looked for signs of basing or bottoming in the stock market. Instead we are seeing bear patterns repeat and rotate. For example If we look at the SP500 we see a new 2 month closing low on an h formation. 3800 was support and we went through it.
More important is the repeatable pendant pattern that is developing in the SP500. This was the same patterns that led to the June lows.Note the red circle aound the flagpole of the pendant to the right. You can see when we broke two weeks ago how the market has been weak ever since
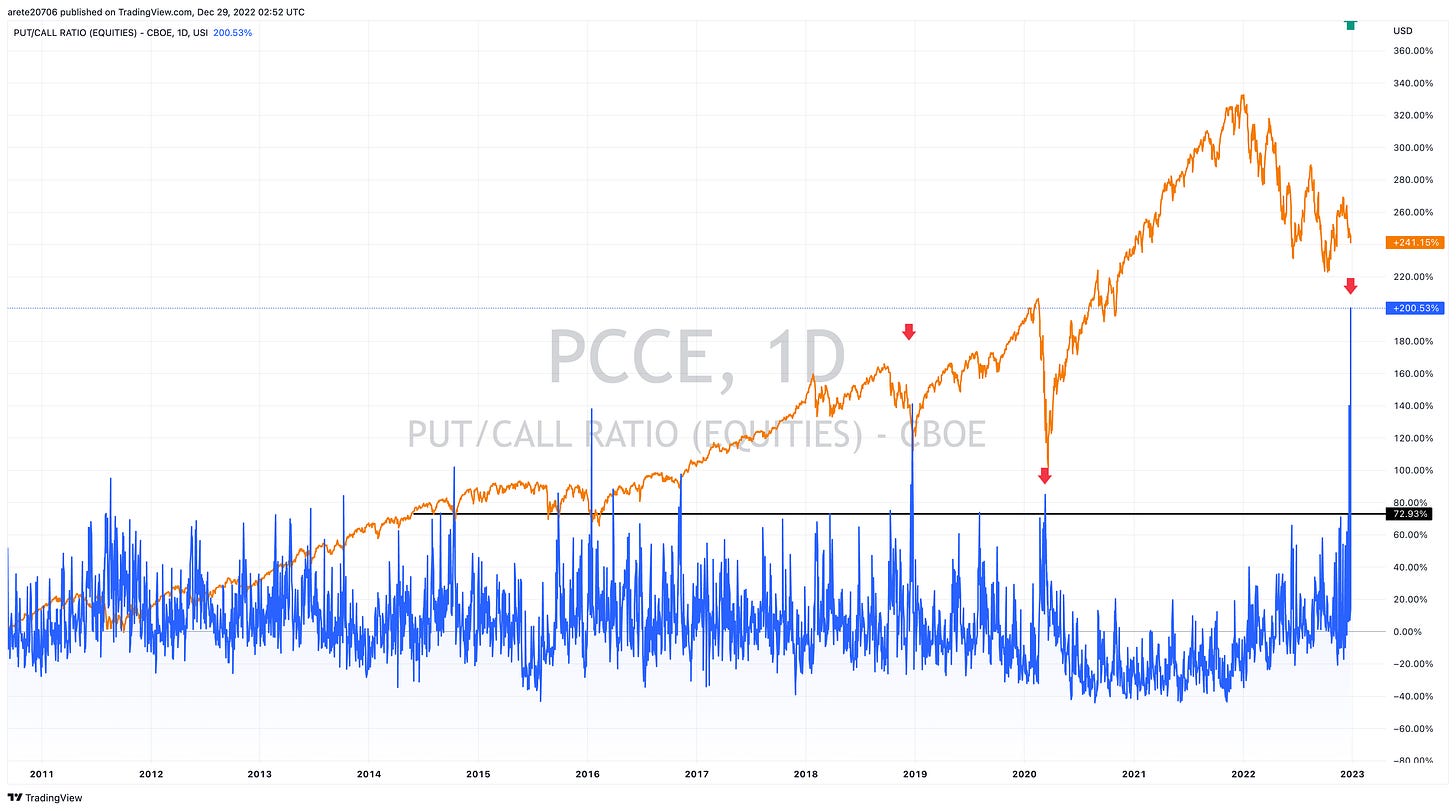
Whether we take out new lows on the SP500 remains to be seen but there are signs of uncertainty. Below is the Put Call ratio on equities. In 5 years we have only had readings this high three times. Each time marked a bottom. This time we kept on selling down.
Those same Put Call spikes were met with Huge VIX spikes that usually mark a bottom. It is standard to expect a large VIX spike as confirmation of capitulation. Instead the VIX did not even move. The question I ask myself is if this could not move the VIX what will it take. Some people suggest the proliferation of daily index options has muted the VIX.
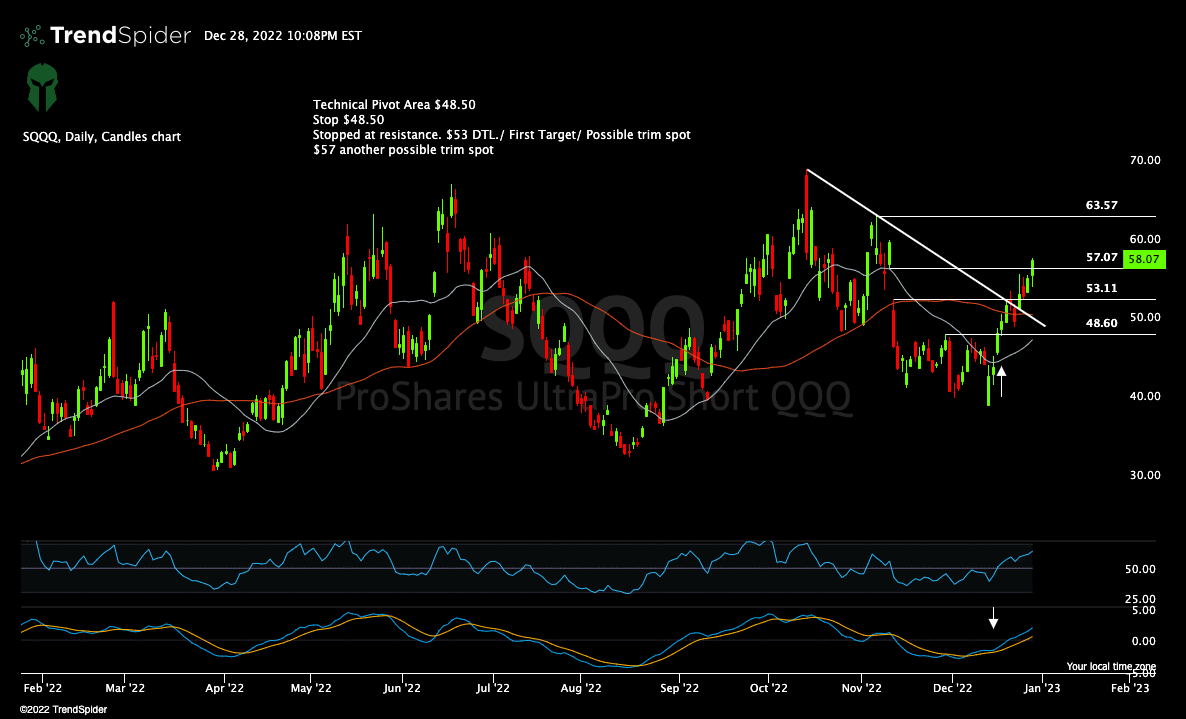
For now I continue to focus on the short side of the market until the VIX sorts itself out. SQQQ is name we have had an alert in alpha chasers for over two weeks now but it seems to be getting stronger. We are up over 20% but look at the indicators. The MACD is crossing the zero line and RSI has made a higher high from the November 3rd high. This is a positive divergence and gives us a $63.57 target.
We are seeing sector deterioration spread. The SOXX began showing signs of weakness and I expect this to spread to others sectors and therefore other Bear ETFs can give similar signals as above. SOXS we are up $4 dollars in less than a week but look at the same pattern MACD and RSI as above.
Look at the over bear ETF of the SP500. SPXS . We are up over 10% but note the pattern. MACD and RSI.
Now that you recognize the patterns understand they duplicate. Charts are nothing more than human behavior quantified. If you can identify a pattern you can look for it to replicate and possibly have a similar outcome.Below is a list of bear ETFs. Consider using the above scan.
Fort more specific levels watch the video below for updates on TSLA SP500 QQQ and what to expect for the rest of the week. Time sensitive. Pay close attention to the technical pivot area on TSLA.
Alpha Chasers Community Waitlist Click Here
1 on 1 Coaching Program Click Here
Wishing Everyone Massive Success in 2023 🍾


