
📈 Chasing Alpha Weekly
The framework for finding leaders before everyone else does.

Chasing Alpha Weekly drops every Sunday. I break down the macro signals, sector rotations, and specific trade setups I’m watching for the week ahead. If you’re new here — subscribe below so you don’t miss it.
Every outlet covered the SpaceX lockup. Every trader knew shares were about to flood the market. Everyone was positioned the same way, on the same side, buying the same puts.
And that’s exactly why it didn’t play out the way everyone expected.
This week I want to walk you through the framework I use to find these disparities — the gap between what everyone expects and what actually happens — because it’s the same framework that’s pointing me toward the new leaders emerging right now. Let’s get into it.
What Happened Last Week
↑ Winners
$SPY breaks above its 55-day — breadth has held above 50% since June 2nd
$IGV ripping — up 34% relative to $SOXX since June 30th
Home construction quietly forming a clean inverse head and shoulders
$XBI and biotech setting up to take out previous highs
$AMGN broke out of a multi-decade base
→ Watch
$SOXX proprietary breadth indicator sitting at extreme levels — historically marks bottoming zones, not confirmed yet
$MSFT grinding to new highs with almost no one talking about it
$RKLB reporting Monday — crushed last quarter, watch the under-55/12-22 cross setup
↓ Laggards
$SNDK weakening technically — declining 55-day, unlike $MU
NAND spot pricing turning negative quarter-over-quarter for the first time
Gold and silver trades carry gap risk I’m avoiding — prefer miners like $SSRM if playing that theme
The index looks constructive. Underneath it, new leadership is forming — and most people are looking for it in the wrong places.
The Framework: Expected Outcome vs. Actual Outcome
Let me walk through the SpaceX trade in detail because I think it’s the cleanest example of a framework you can use over and over again.
Before the lockup, SpaceX was trading around 71 million shares a day on average. The lockup released ~900 million shares onto the market — a genuinely enormous supply event. Every financial outlet covered it. Every trader I know was aware of it. The expected outcome was universal: this crashes.
Here’s the question that actually matters: how many people were on that side of the trade? Because when virtually everyone expects the same outcome, they’ve already positioned for it. The puts are already bought. The hedges are already on. There’s no one left to sell.
We bought at the open. Not because of a technical setup — because of the mechanics of positioning. When puts that were bought to hedge this lockup start getting unwound, the market makers who sold those puts have to hedge their own delta risk — which means buying stock or calls in the open market. That’s a structural buying mechanism that has nothing to do with sentiment.
This is the framework behind almost everything I trade on the longer side: what does everyone already know, and what happens when that consensus doesn’t play out the way the crowd expects? That gap is where the actual edge lives.
The same framework applies to $PLTR right now. The stock crushed earnings — net income tripled year over year — and pulled back anyway because people are trading it based on what it was two years ago, not what it is today. Almost nobody is pricing in the actual acceleration happening in the business.
Enjoying this so far? Chasing Alpha Weekly goes out every Sunday. Subscribe below so you never miss a week.
Not All Memory Is the Same Memory
I want to spend real time on this because I think it’s one of the most underappreciated dynamics in the market right now.
$MU and $SNDK get lumped together as “memory names.” They are not the same trade.
Since DRAM’s IPO, $MU is up 132%. $SNDK is down 67%. DRAM pricing is up 73% over that same window. NAND spot pricing — SanDisk’s core business — just turned negative quarter over quarter for the first time.
Technically, the divergence is just as clean. $MU is holding its 55-day moving average. $SNDK has a declining 55-day. Objectively, technically, $SNDK is the weaker chart.
This isn’t a call that memory as a category is broken. It’s a call that DRAM and NAND are behaving completely differently right now, and treating them as interchangeable is costing people money. Long $MU / short $SNDK has realized roughly 33% as a pair trade since March 30th.
The people who are aware of this NAND-versus-DRAM divergence are still a small minority. That’s exactly the kind of information asymmetry worth paying attention to.
The 5 Setups I’m Watching This Week
📌 $IGV — The New Leader Nobody Wants to Admit
Up 34% relative to $SOXX since June 30th
Formed an “abandoned baby” reversal pattern — gapped down, isolated candle, then exploded higher
$MSFT quietly grinding to new highs while almost nobody discusses it
Software might be the sector nobody is positioned for. When a group this unloved reverses this violently off a rare technical pattern, that’s worth respecting, not fading.
📌 $MU vs $SNDK — The Pair Trade Still Working
$MU holding its 55-day, $SNDK’s 55-day pointing down
DRAM pricing continuing to grind higher while NAND spot pricing softens
Long $MU / short $SNDK realized roughly 33% since March 30th
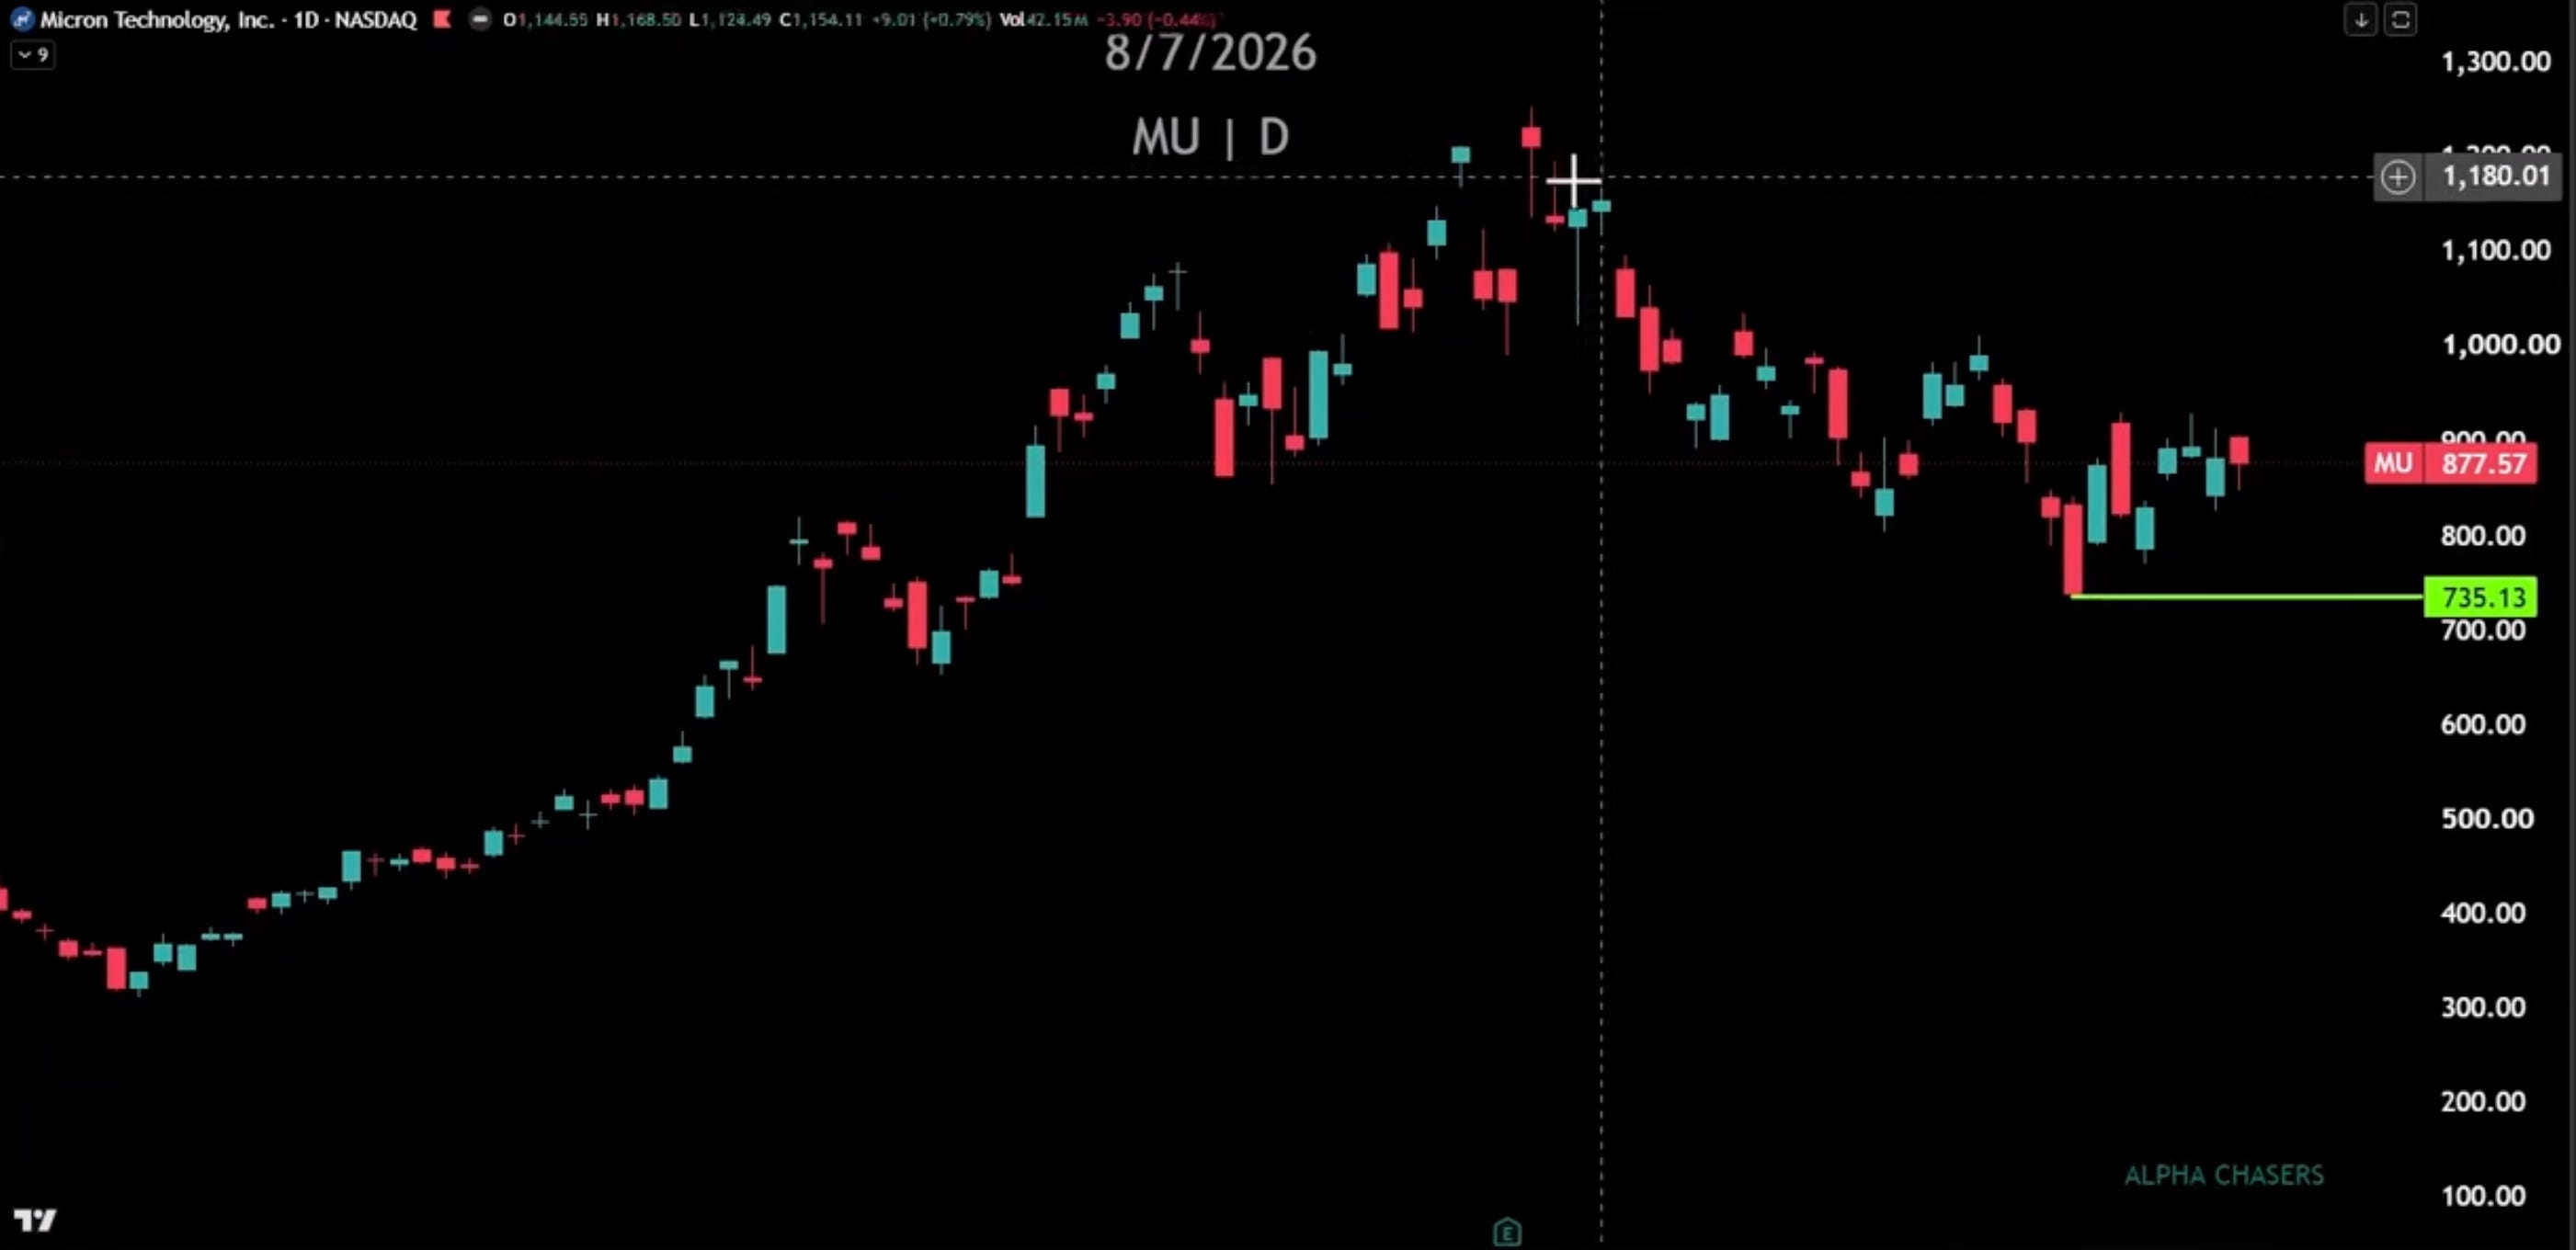
This divergence is not fully priced in yet. Watch NAND spot pricing weekly — if it stabilizes, the pair trade thesis weakens. Right now it’s still deteriorating.
📌 $PLTR — Earnings Acceleration Most People Are Ignoring
Net income tripled year-over-year
Stock pulled back post-earnings and is now ripping back toward highs
Anyone shorting this today based on the company from a year ago is trading a completely different business
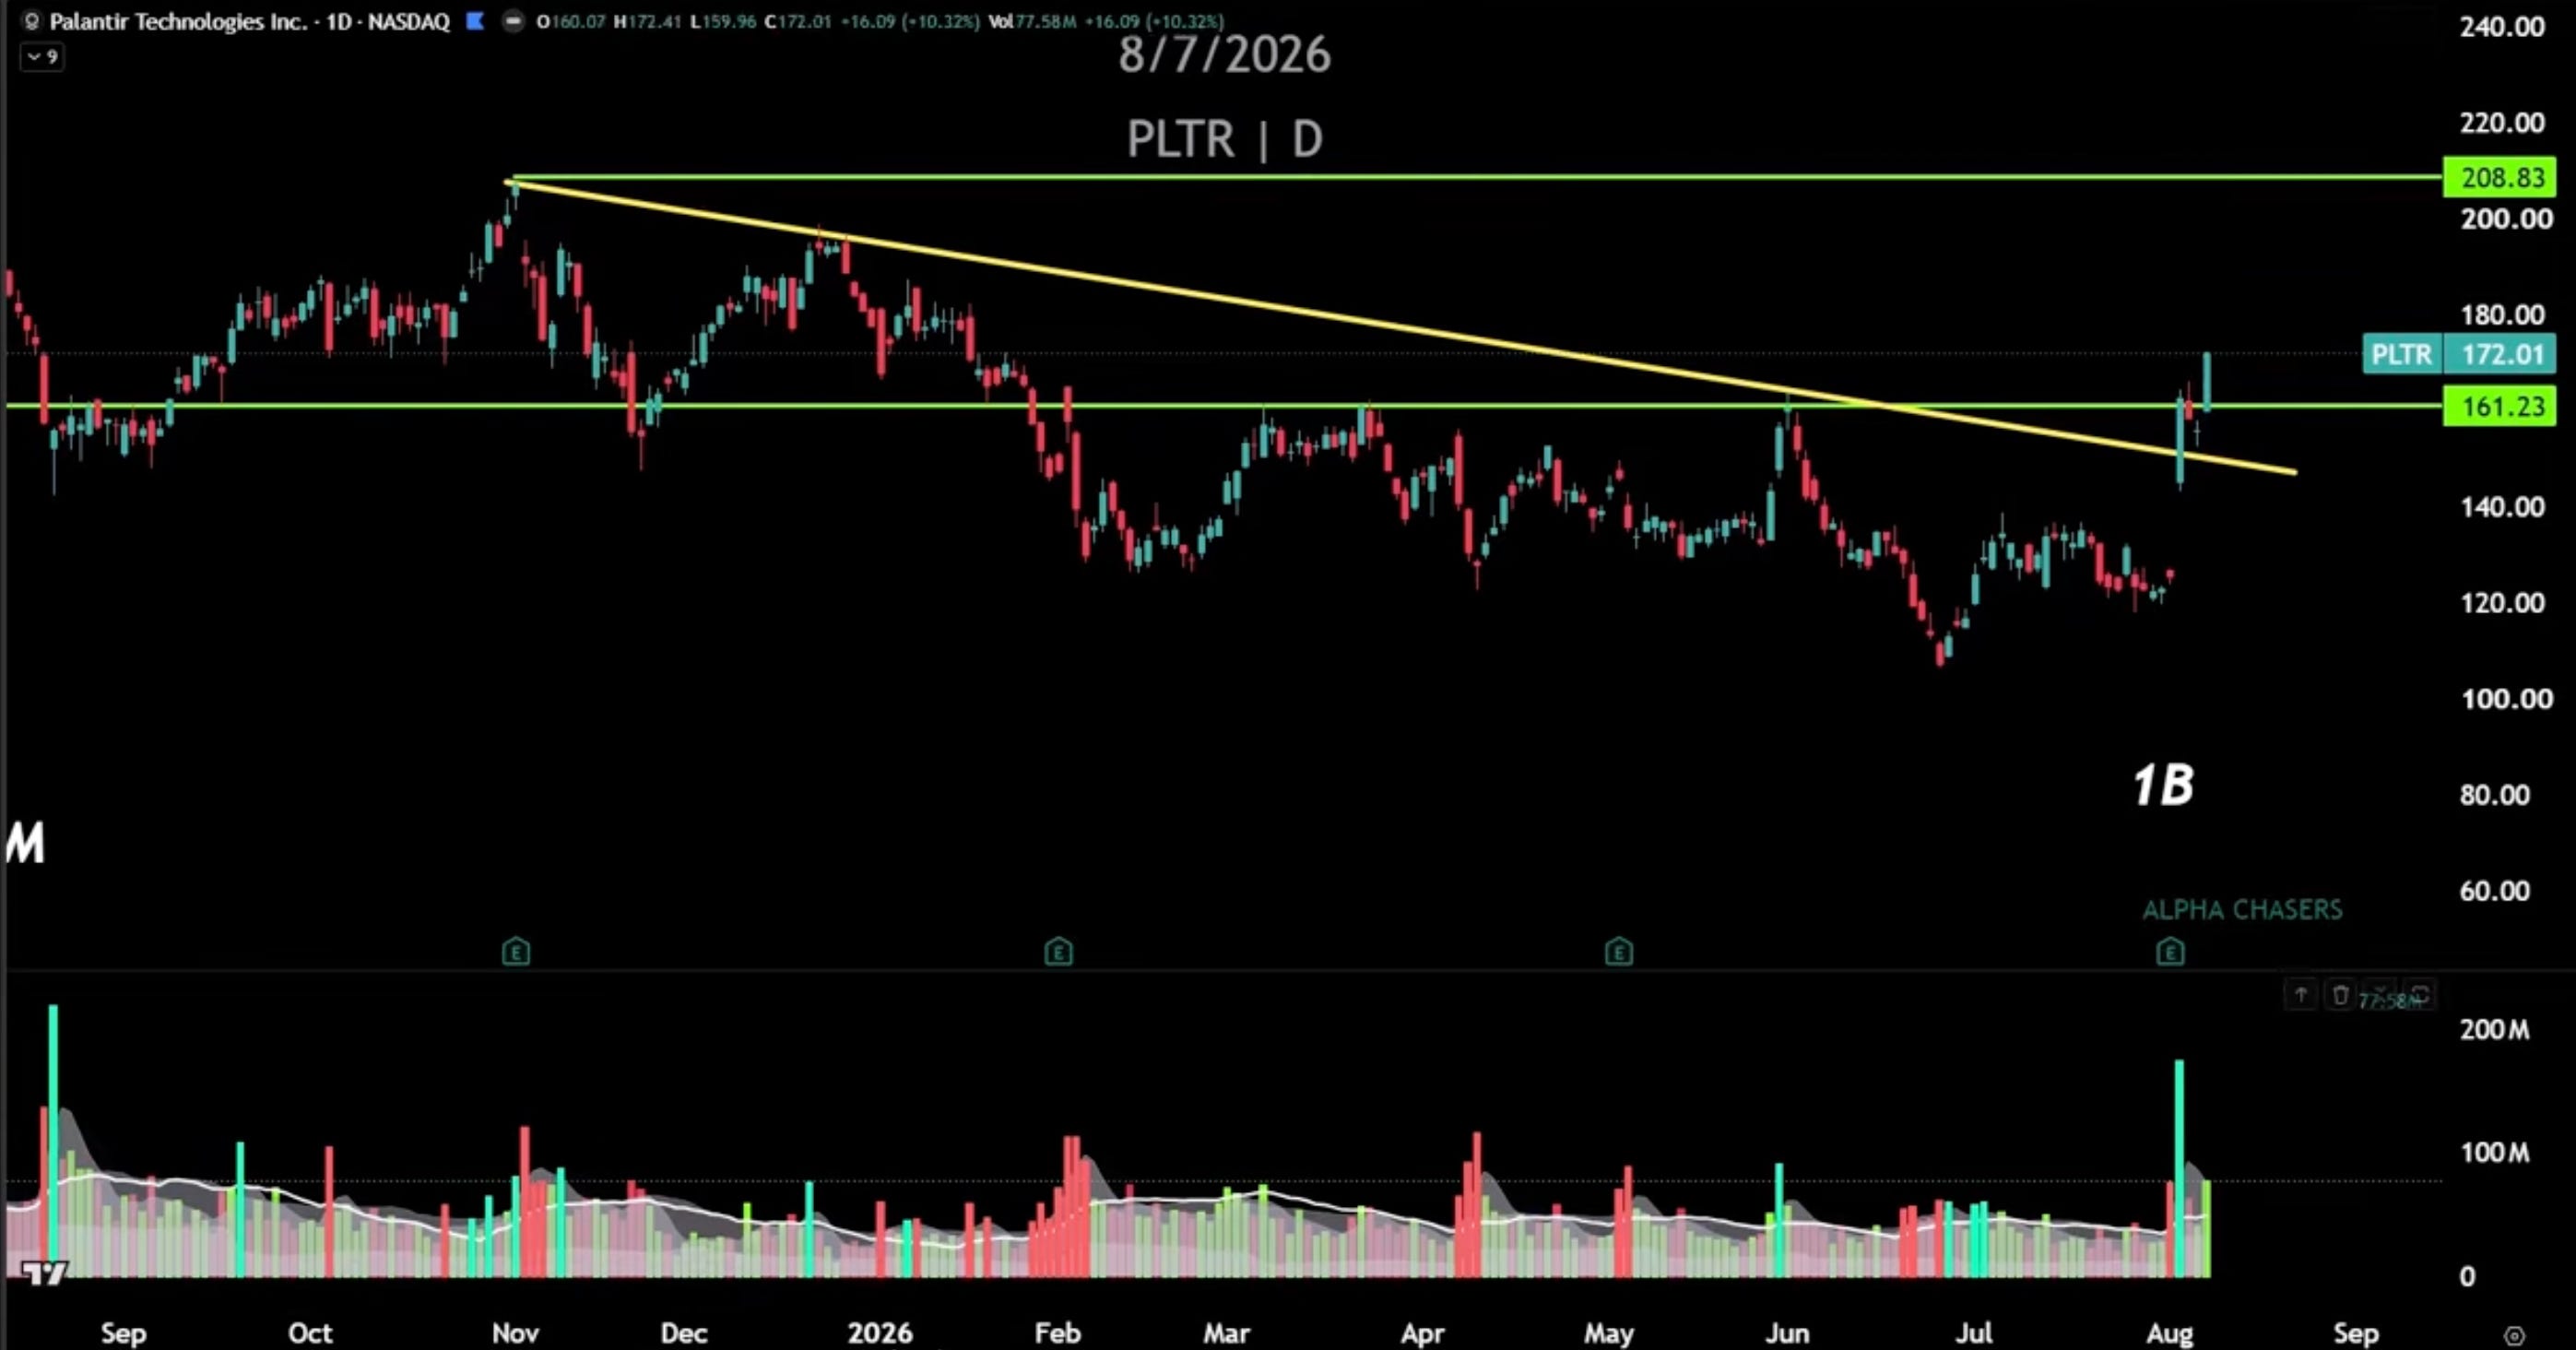
The revenue and earnings acceleration here is real and substantial. The disparity between what the business is doing and what the crowd believes it’s doing is exactly the kind of setup this framework is built to catch.
📌 Home Construction / $XHB — Not a Recessionary Chart
Clean inverse head and shoulders forming
Held through a weak jobs report without making a meaningful new low
Lower rates read through directly to $HD, $LOW — the “honeydew list” names
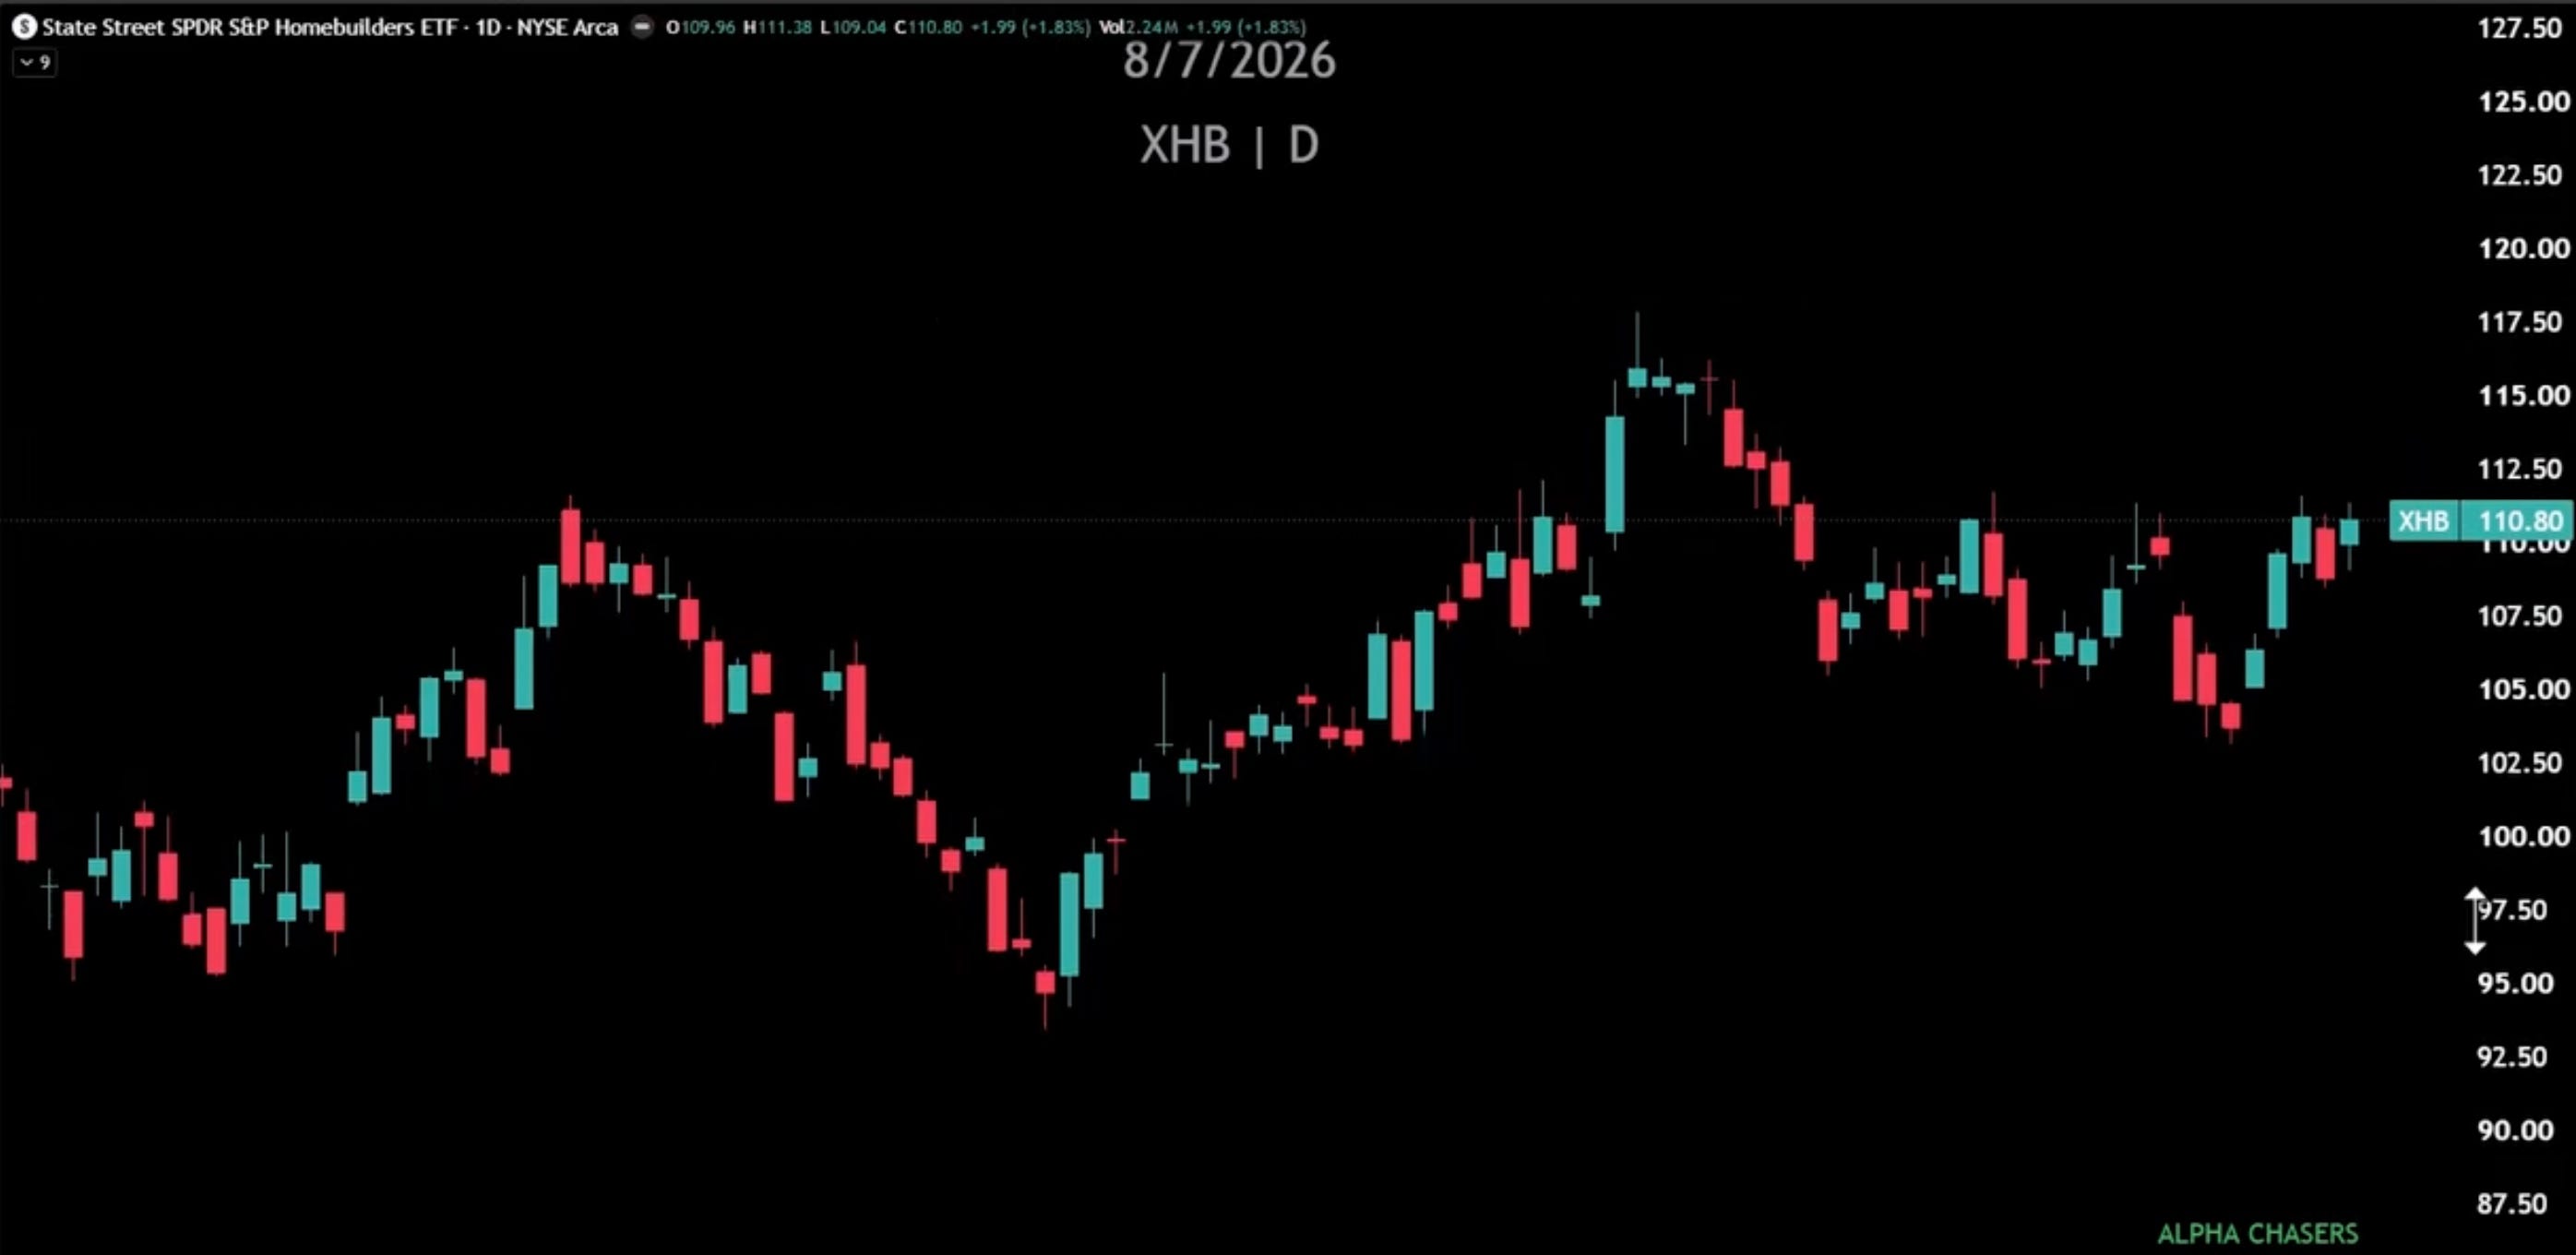
Everyone keeps talking recession. This chart does not agree. If the neckline confirms, this is a clean long setup heading into a lower-rate environment.
📌 $XBI / Biotech — Setting Up to Take Out Highs
Biotech broadly crushing it, $AMGN broke out of a multi-decade base
Long biotech, short a weaker name in the space as a pair trade — working well
Technically setting up to take out prior highs
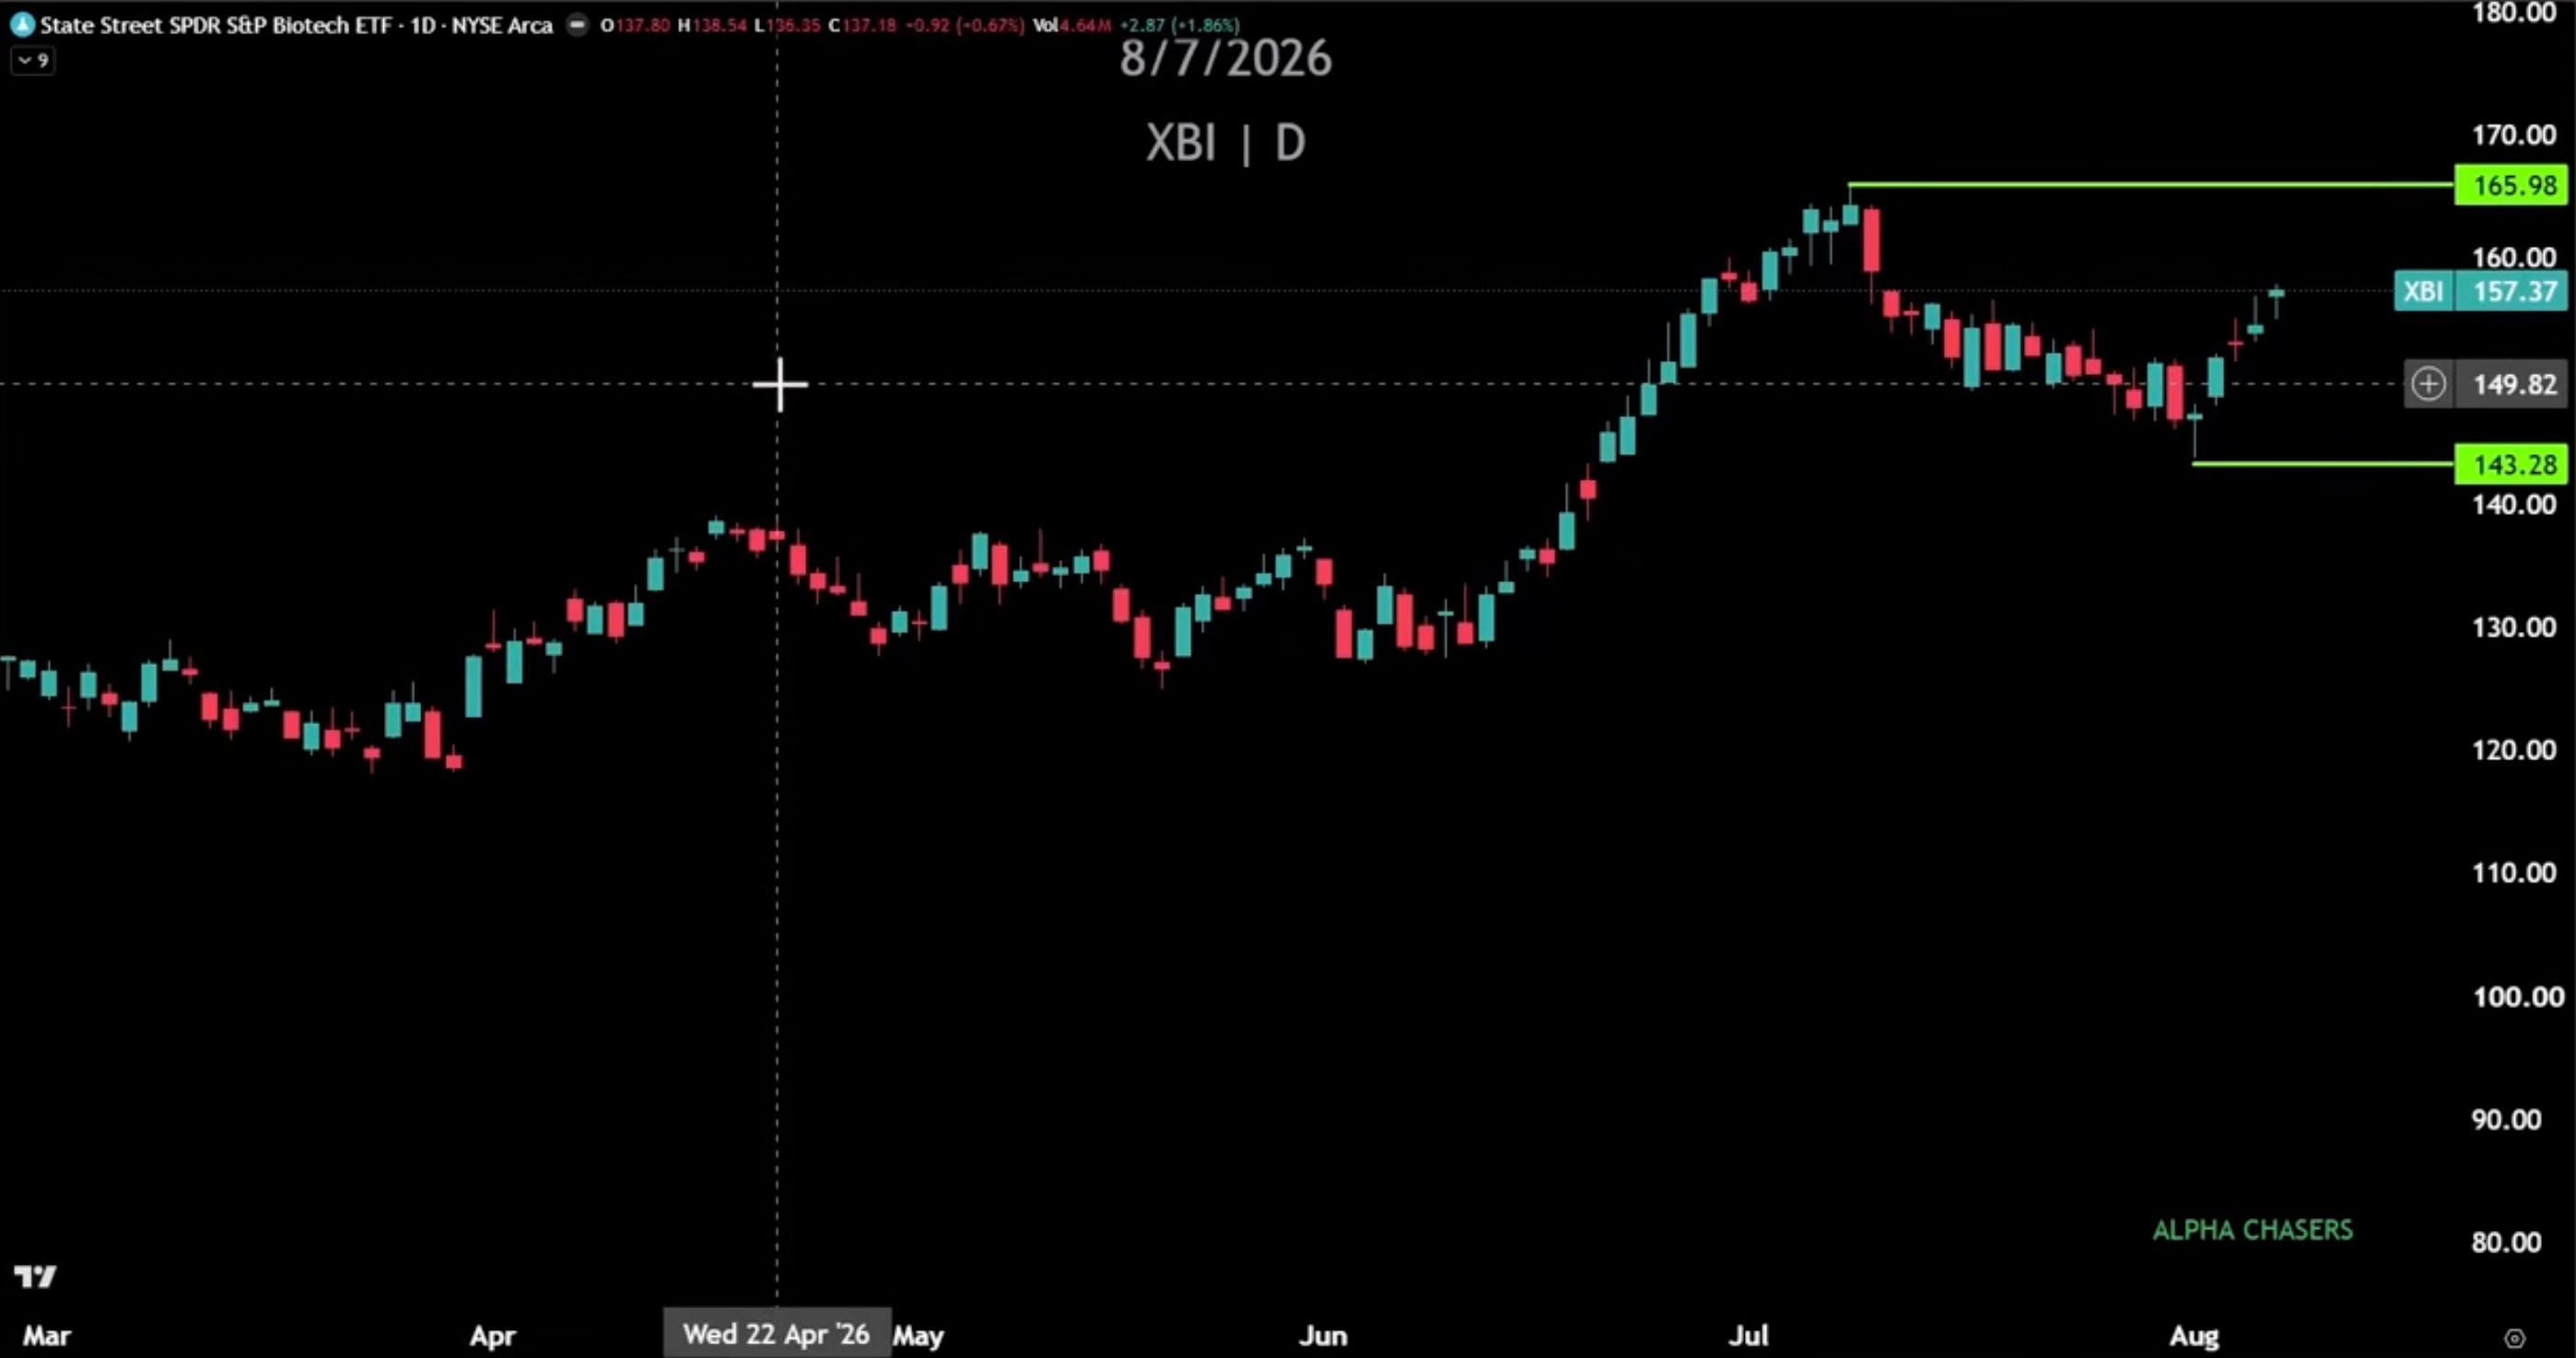
Every pullback produces new leadership. Biotech is emerging as one of the clearer candidates and most people are still anchored to the names that led the last cycle.
What I’m Watching This Week
$RKLB Earnings — Monday
Crushed last quarter. Watch the under-55/12-22 moving average cross setup — historically a strong signal when it triggers viciously to the upside.
NAND Spot Pricing
The $MU vs $SNDK divergence hinges on this continuing to soften. Watch it weekly.
$SOXX Breadth Indicator
Sitting at extreme levels historically associated with bottoming zones. Not confirmed yet — watch for the reversal signal.
Home Construction Neckline
If this inverse head and shoulders confirms, it’s a clean signal the recession narrative is overstated.
The Bottom Line
Everybody being positioned the same way isn’t a reason to follow the crowd — it’s usually the reason not to. The SpaceX lockup unwound in the opposite direction of consensus because consensus had already fully priced in the expected outcome, leaving no one left to sell.
That same framework is pointing toward real opportunities right now: the NAND-versus-DRAM divergence in memory, the earnings acceleration in $PLTR that the crowd hasn’t caught up to, and new leadership forming in software and biotech while everyone stays anchored to last cycle’s winners.
Find the gap between what everyone expects and what’s actually happening. That gap is where the edge lives.
The full breakdown — including the complete reflexivity framework, the SpaceX lockup mechanics, and the full $MU vs $SNDK pricing analysis — is on YouTube now.