📈Chasing Alpha Chart of the Day
Nvidia will be one of the most closely watched earnings releases this week.Earnings are set to be released Wednesday evening with a consensus estimate of .81 EPS and $6.01 Billion in revenue. Guidance will be key and expectations maybe be high after GFS and LSCC earnings beats and guidance raise.
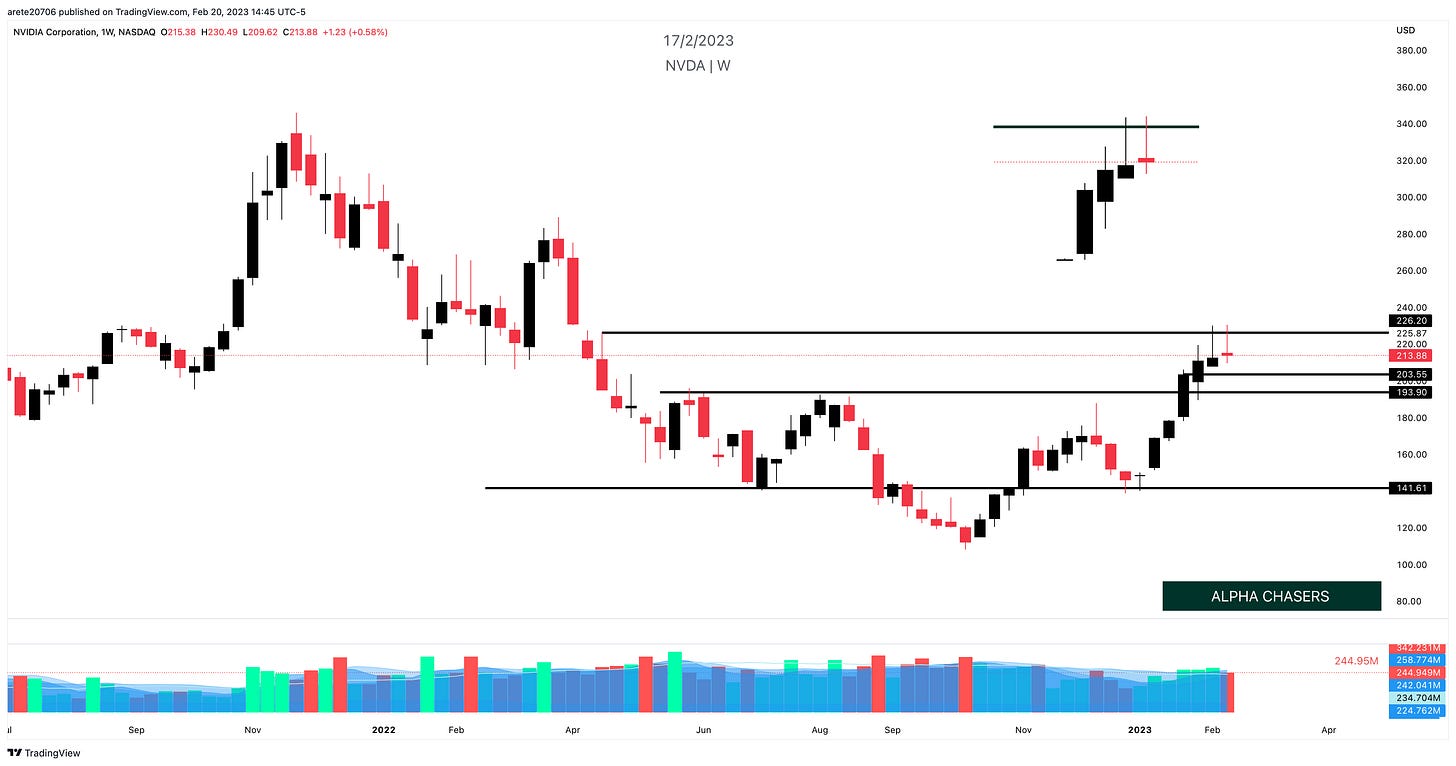
On NVDA weekly chart we can see the last two weeks have large wicks on the top of the candle. This signifies selling and buyers not willing to pay those prices. $230 level has been tested the past two weeks and held as resistance.
A pullback is not out of the question after a head and shoulders or inverse head and shoulders is broken. We can get a retest of those levels. Its actually healthy. That could lead to a test of the 193.80 area. You can clearly see the inverse head and shoulders and neckline below.
On the NVDA daily chart. There are signals showing that the stock may be due for a pullback. If we look at the MACD (moving average convergence divergence) we can see that the MACD (blue) has crossed the signal line (orange). This is usually a sign that we might need a rest.
On a longer time such as the NVDA weekly chart , we can see it breaking out with MACD actually accelerating. Usually this suggests any pullback may be short lived.
Overall this week will be extremely volatile especially after earnings are released. The after hours and the next couple days of trading will see massive swings as the news is digested. Option markets are currently showing the move to be 10% . This means we can expect roughly 20 point swing in either direction. For more on what earnings plays I am watching this week watch the video below.
Alpha Chasers Community Waitlist Click Here
1 on 1 Coaching Program Click Here
Wishing Everyone Massive Success in 2023 🍾


