


📈 Downside Follow Through
This is what the market is telling us...

Downside Follow Through
Yesterday we saw a follow through day from Friday’s red candle, with the NASDAQ down over 1% and the S&P 500 down about 0.5%.
Let’s run through the indexes so we can see what’s happening right now.
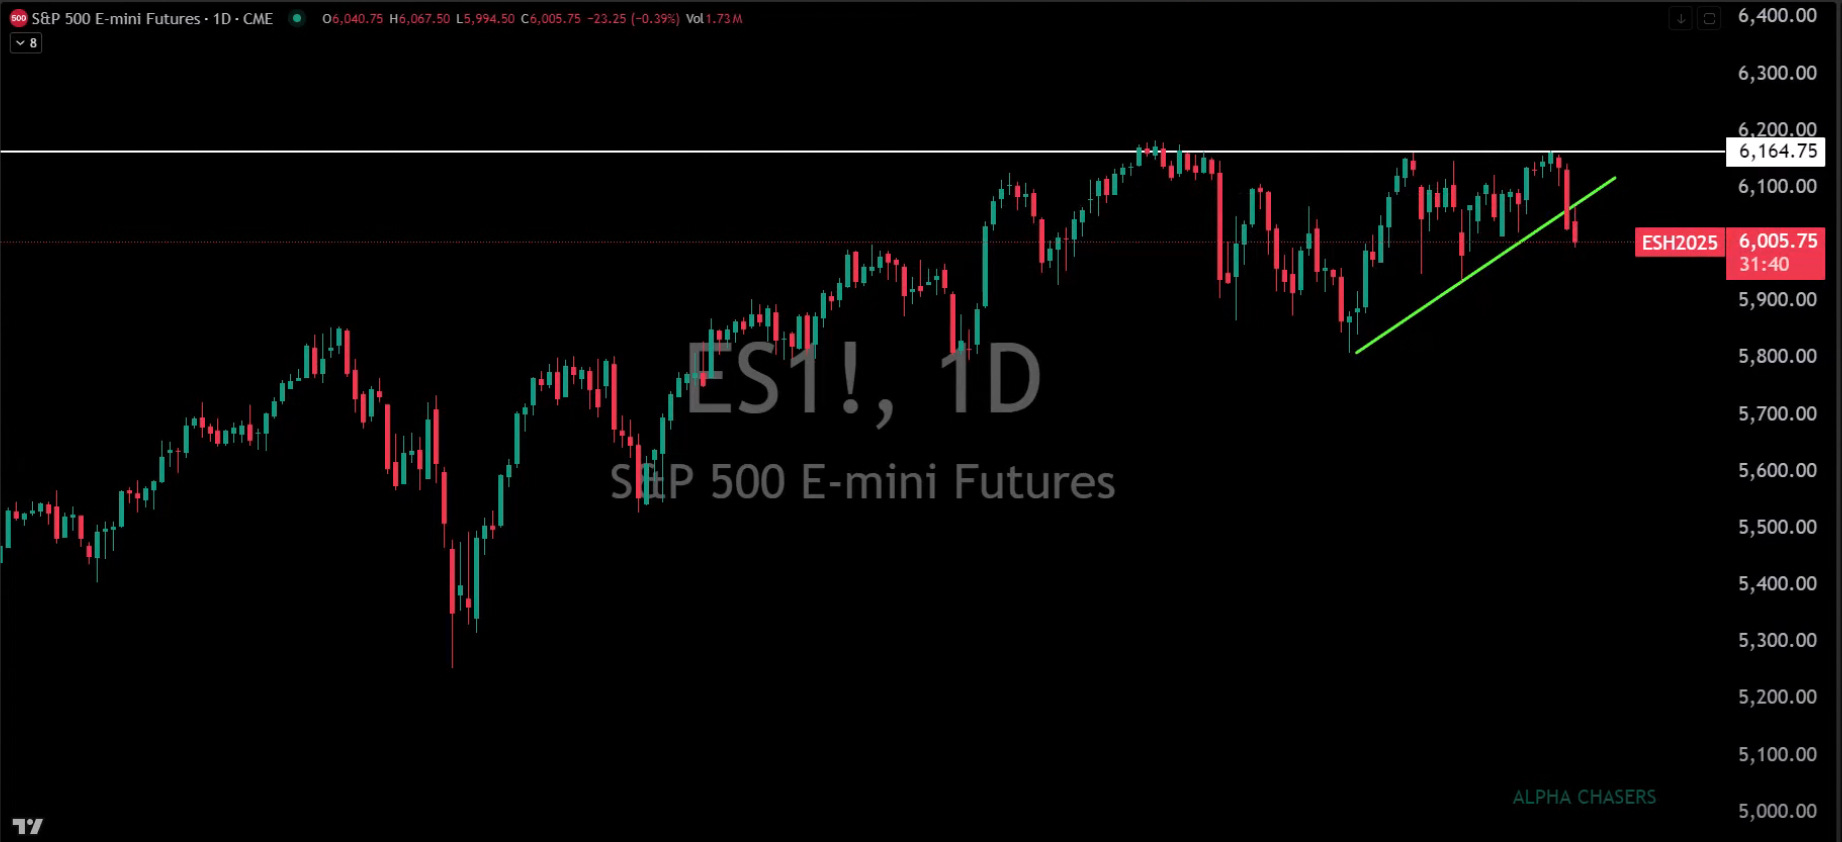
On the S&P Futures you can clearly see that we formed a rising wedge, broke below it, and now have a confirmation bar down. This is the opposite of what you want to see.

The Nasdaq Futures look just as bad, plus you have now broken below 50 on the RSI.
You can see the longer term trendline drawn that we hope can act as support. While it is possible, I wouldn’t be banking on it to save you.

Looking at the breadth of the market, you can see that NYA is starting to roll, and the McClellan Summation (bottom) also looks like it’s rolling, unable to even test the zero line.
These are all textbook setups of breakdowns.

Meanwhile, we are seeing zero signs of panic whatsoever. The VIX is slightly elevated, but nowhere near a level of panic in the market.
For a bottom to form, we need the VIX to move much higher than where it’s currently at.
While these are certainly bearish signs, there’s a lot to understand fundamentally about what’s going on in the market right now so you can find the sectors and stocks that are flourishing.
Watch this video for my analysis of where we’re at right now and what to do about it: