This week we saw several indications that the Energy trade may have a ways to go. The long awaited OPEC+ and Russia meeting took place. They seem to be in agreement and cut 2 million barrels of crude oil out of supply per day. This was the high end of the range.
The current administration was arguing for less cuts but that was ignored. The range was set at 500,000-2,000,000 and they went with the high end. This sent crude oil prices higher and finished the week up over 11%
Taking this much supply out of the market as well as the dwindling strategic reserve is setting crude oil up for another bull cycle. Goldman Sachs said in a note on Wednesday: “After the cut latest reduction in output by OPEC+ is sustained through December 2023, it would amount to $25 per barrel upside to our Brent forecast, with potential for price spikes even higher should inventories fully deplete. Goldman Sachs raised its 2022 Brent price forecast to $104 per barrel from $99 per barrel and 2023 forecast to $110 per barrel from $108 per barrel. With the OPEC cut and the current administrations energy policy there is little chance inventories will not deplete. The one bright spot in keeping gas prices down is the Strategic petroleum reserve. Even that has its limits. Right now we are currently at 1985 levels on the SPR and at the current rate will run out in 30 days.
Strategically SPR has been used by several administrations in the past during election cycles to deflate gas prices. The larger issue is how oil and gas prices move after the midterms. One chart shows that oil is the only commodity bucking the trend of the strong dollar. Usually when the U.S. dollar is strong we have weak commodity prices. Crude oil(green) kept going up even with the stronger dollar(orange). While natural gas and other commodities came down(blue)
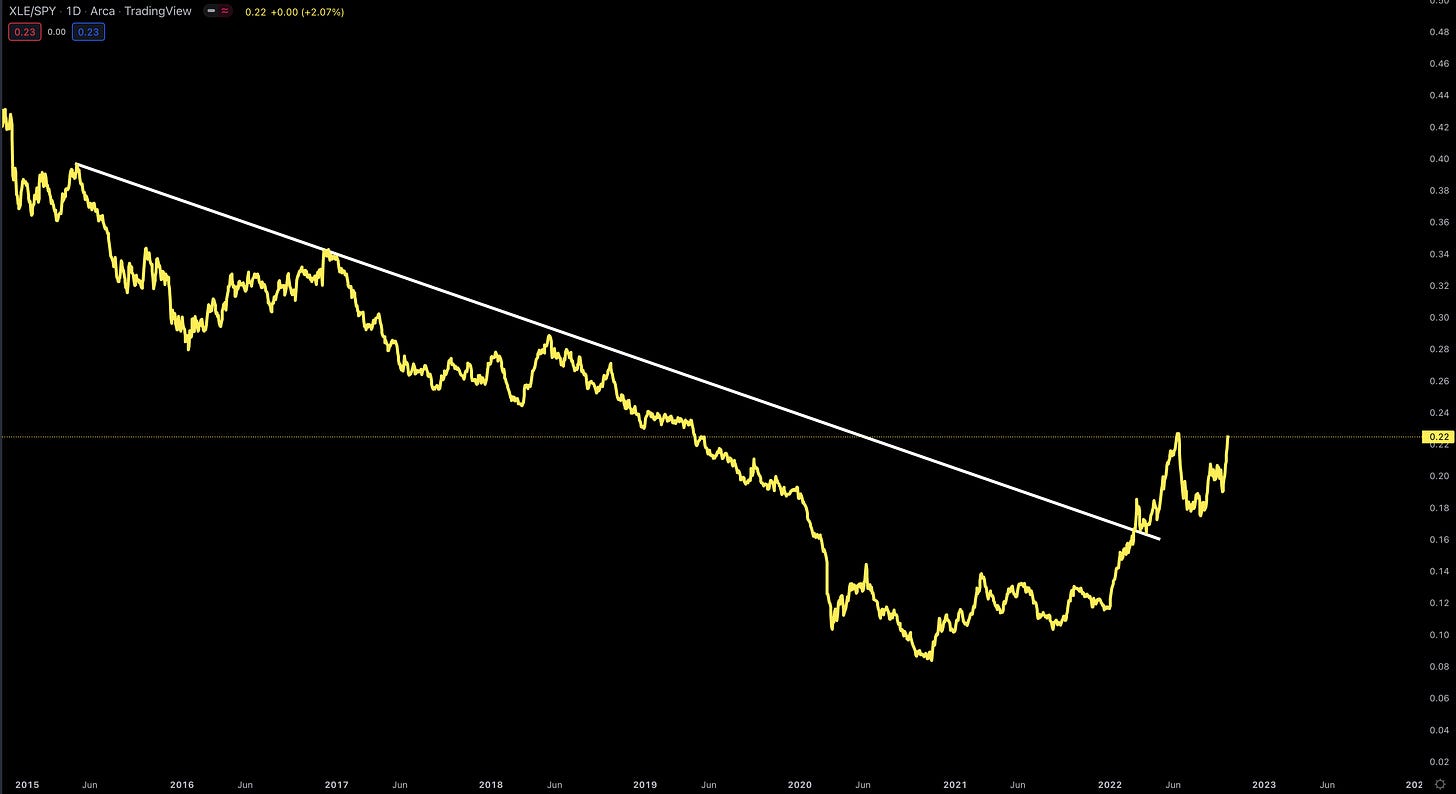
The correlation between the Energy sector and the SP500 has been an important metric. Usually the correlation means the stronger the sector is the weaker GDP will be since the U.S. economy is reliant on oil. For our purposes it shows a 7 year downward trend that recently broke out in May 2022. This is setting the sector up for possible multiyear out performance.
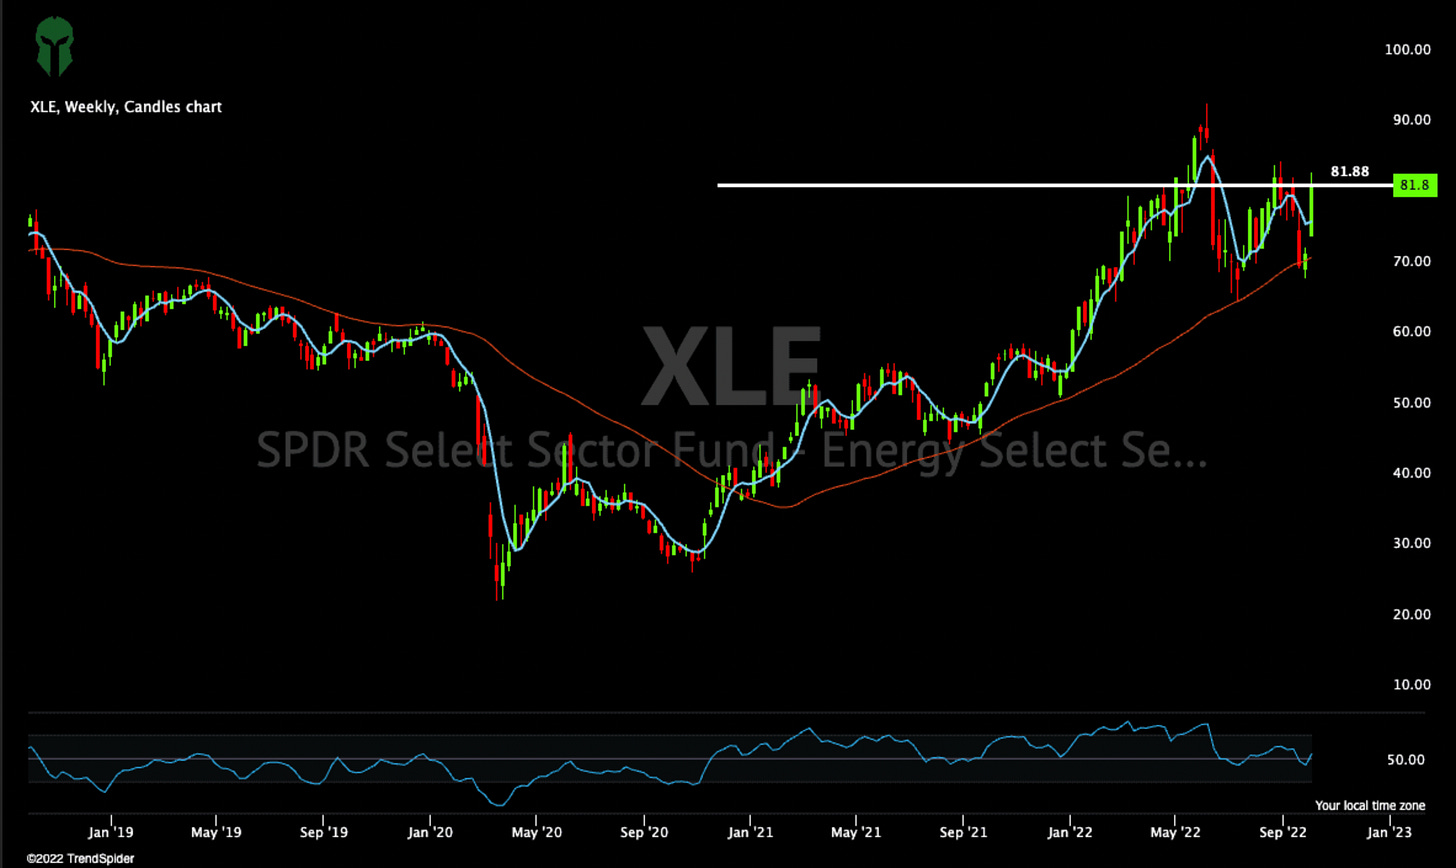
The Energy sector($XLE) closed at a two month high. We closed above the 5 week SMA which very few stocks are doing let alone sectors. The 50 week SMA is major support.
I would pay close attention to the energy sector. If you want to learn more simply click the video below. I cover what to look for next week as well as several other stocks and some short ideas. Pay close attention to the correlation with the dollar.
Have a great weekend!
Preview the Trading Community CLICK HERE
Trade to Win!


Thanks for sharing! New here, learnt a couple of things from your YT videos too. Just curious, how would you confirm the breakout from XLE? Retest to validate a new uptrend?