📈Fed Rate Hike Causes Huge Volatility
Federal reserve board hikes rates 75 basis points and leaves door open for more. After the 2 PM announcement of the hike the indexes sold off almost 3% across the board. This was followed by holding key support levels and rallying into Jerome Powell’s speech at 2:30. We gained all of the loss and made new highs on the day. After the 3% rally we rolled back over slowly at first and then accelerated into the close. We sold down the entire rally and made new lows smashing through support levels. The most reasonable answer is Powell left the door open for another 75 basis point rate hike. The personal savings rate at around 5% which is historically much lower than the 7% range. This shows us that more people are struggling with their bills. An increase in rates raises the cost of everything from mortgages to credit card bills. Therefore higher rates lead to less spending and that is driving the economy into a slowdown. We saw the 10 year treasury rally to 3.5% and the 2 year treasury is at 4.08%. This is what is referred to as an inverted yield curve. When investors are being paid more for investing on shorter durations it means they believe rates will be lower in the future from where they currently are. Essentially they believe the Fed will be too aggressive and overreach and therefore have to cut rates shortly. The inverted yield curve has been fairly accurate for decades. (see below)
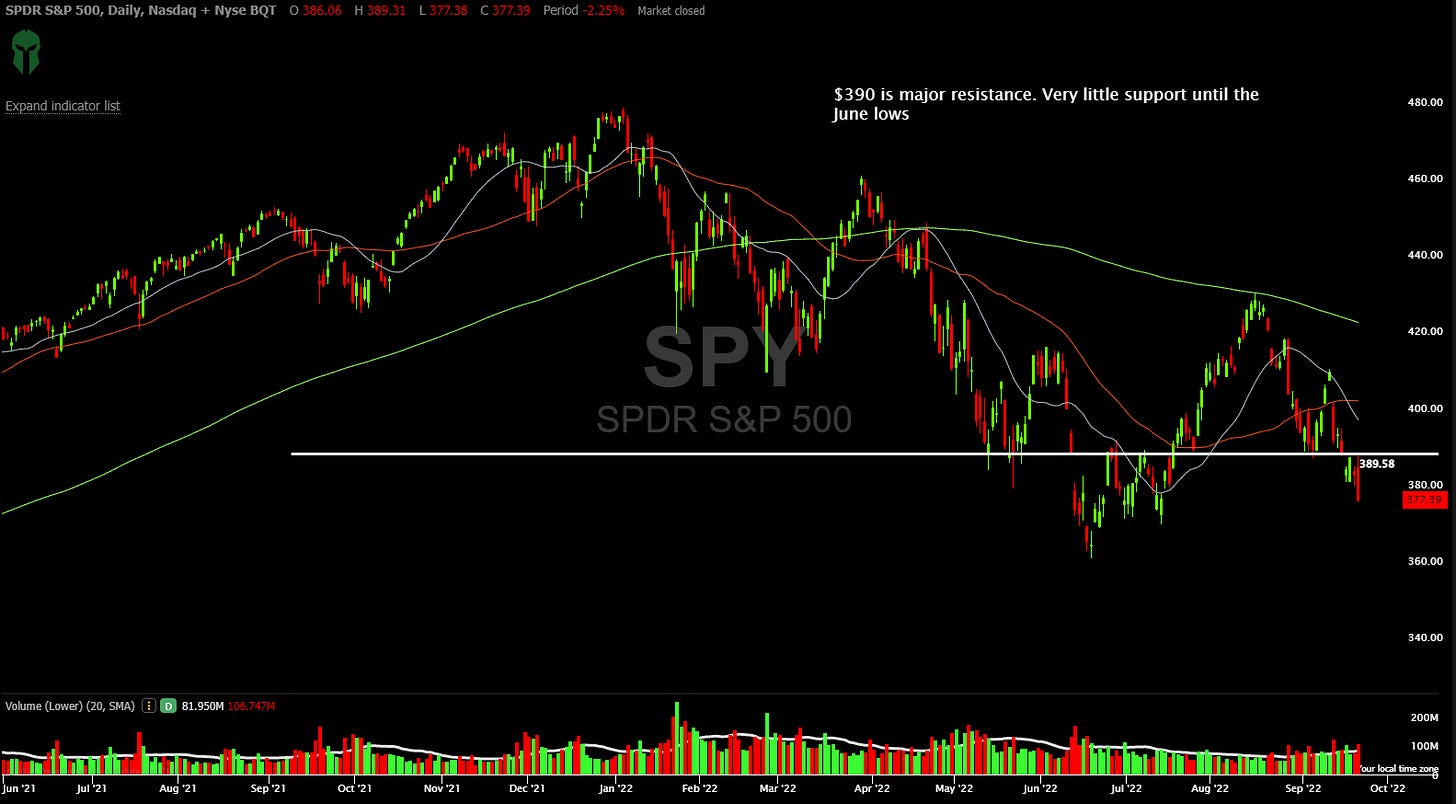
Its important to see how the indexes act tomorrow after digesting everything that happened today. One stand out that we must focus on was the huge volatility today. The average daily range on an index is usually 1-2% . It is very rare that an index will move almost 3% three separate times in less than 2 hours. Large swings in volatility such as this lead to significantly large moves in the indexes. It is not always to the downside. The take away here is to expect more volatility. Take time to watch tonight’s video. It will explain in detail how you can spot resistance points on the indexes very easily. It is a great companion to the Index charts below marked with key levels. I also have key levels marked on the leading stocks and two short ideas. Let’s get to it!
In tonight’s video. There are short term long ideas and two short ideas. Pay close attention to how to spot major resistance points on charts.
Preview the Trading Room AT Community
As always any questions email Arete@aretetrading.net
📈Trade to Win


