Measuring Overbought
We have seen a massive run up in multiple stocks over the past few weeks, such as NVDA, SMCI, and MSTR. How do you know when the move is over?
One of the primary indicators I use to understand when a move may be coming to an end is Bollinger Bands.
Bollinger Bands give you an understanding of standard deviations with regard to a move and what the probability of a move continuing is.
Example 1: MSTR
The chart below shows MSTR with the Bollinger Bands indicator.
We can see that we are at (or over) the third Bollinger Bands which represents the third standard deviation. Each line represents one standard deviation.
Statistically there is a 99.7% chance that you stay within the third standard deviation. This doesn’t mean that the stock is going to crater, but it does mean it may need some time for the 20 SMA (the yellow line) to catch up.
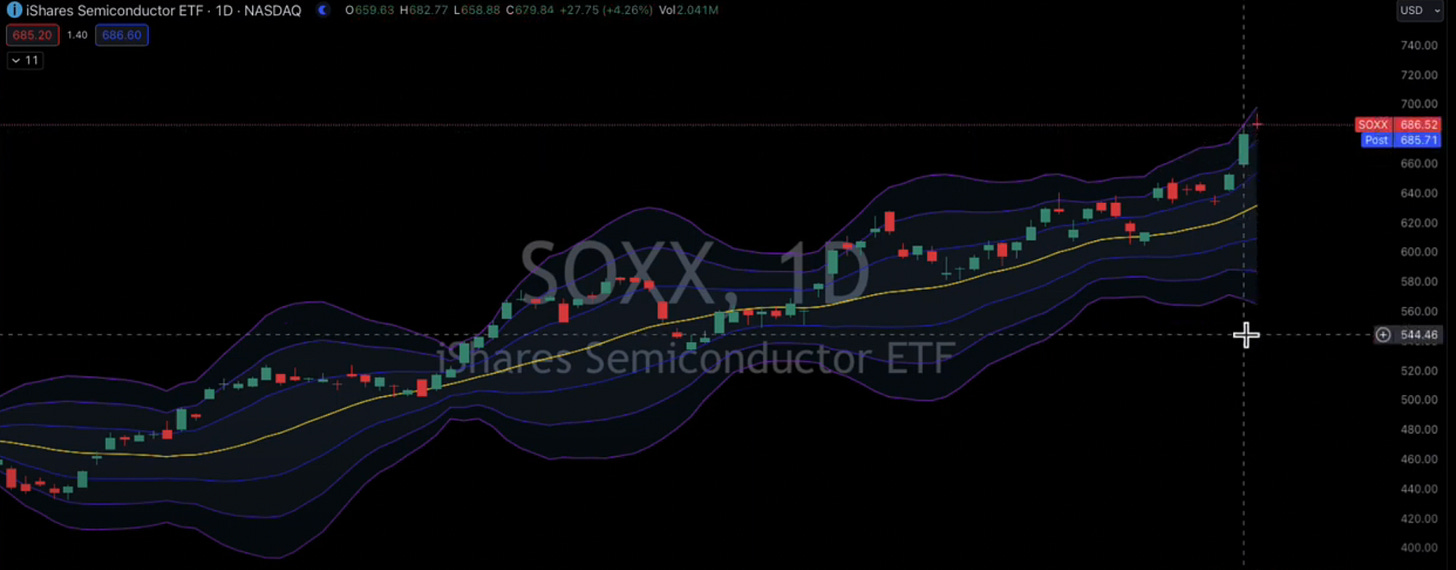
Example 2: SOXX
Let’s look at the Bollinger Bands on the SOXX.
You can see that we rejected breaking out of the third Bollinger Bands (as is statistically most likely).
This shows that semiconductors may be due for the 20 SMA to catch up as well.
Again, do not assume that this means the stock will drop. It can go sideways until the 20 catches up. There is also a small chance that it can continue to run.
I explain Bollinger Bands and how to use them in this clip:


Thank you, mentor 🙏🏻