Market Internals
There are a number of indicators and charts I use to understand what’s going on under the hood of the market.
Here are two that I’m focusing on right now.
NYSE Composite Index
This gives you the broadest sense of how the market is performing. I couple this with the new highs/new lows indicator.
What interests me is that it looks like we have bottomed. We are seeing declines become smaller in scope and advances increasing in scope. The advances are reaching levels that we haven’t seen since the past strong run in the market.
Zweig Breadth Thrust
I reviewed the Zweig Breadth Thrust in a newsletter post last week. As a reminder, it gives us an indicator of market momentum by calculating a 10-day moving average of advances / total # of issues in the NYSE.
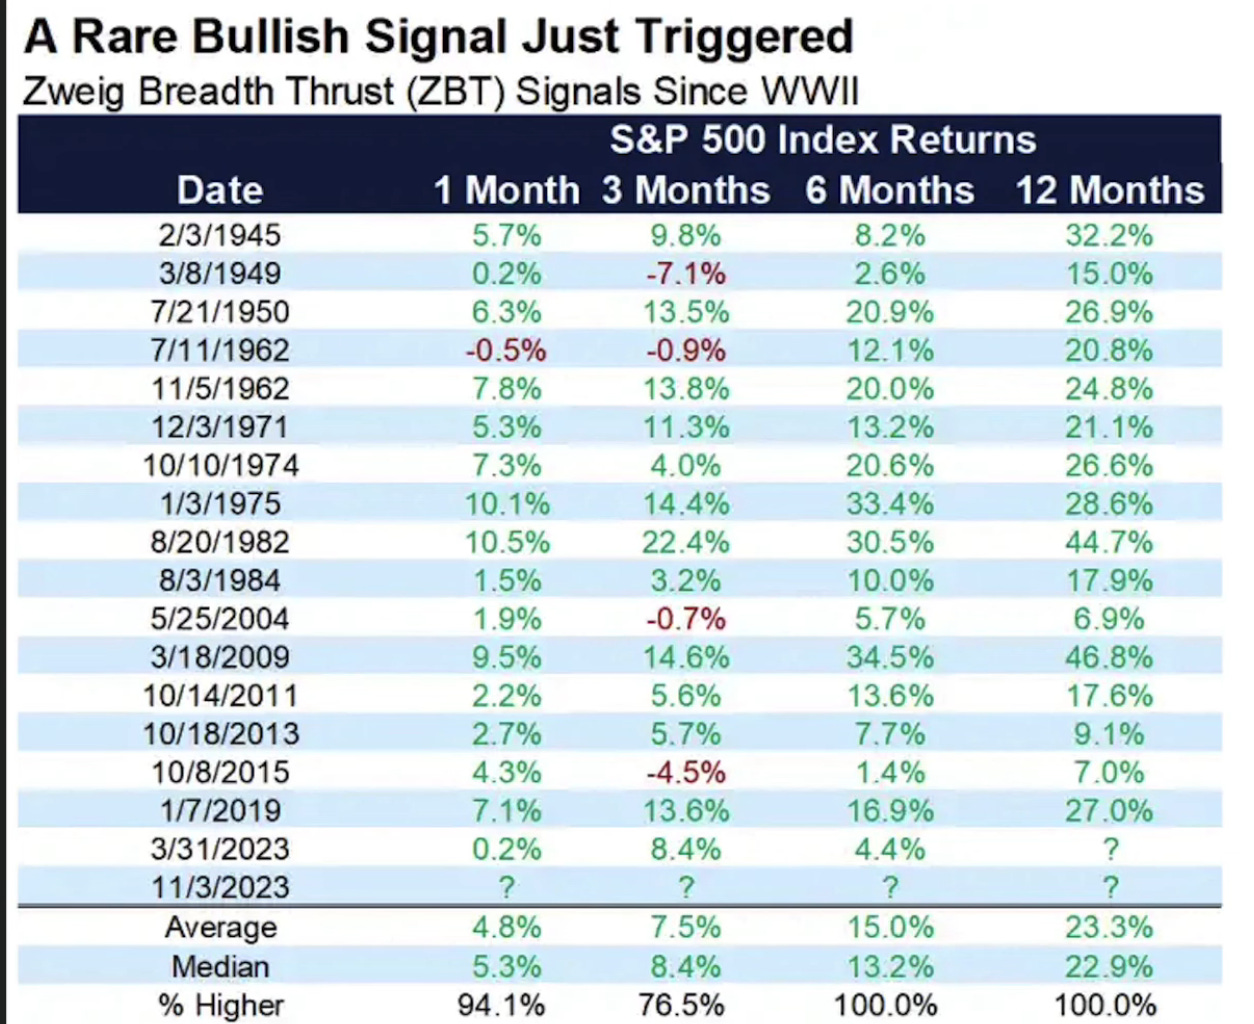
When the Zweig bullish signal triggers (when you move from below 40% to above 61.5% in any 10-day period), these are your historical results:
While these are very positive results, keep in mind it is not statistically significant, but I do still think it is important to understand.
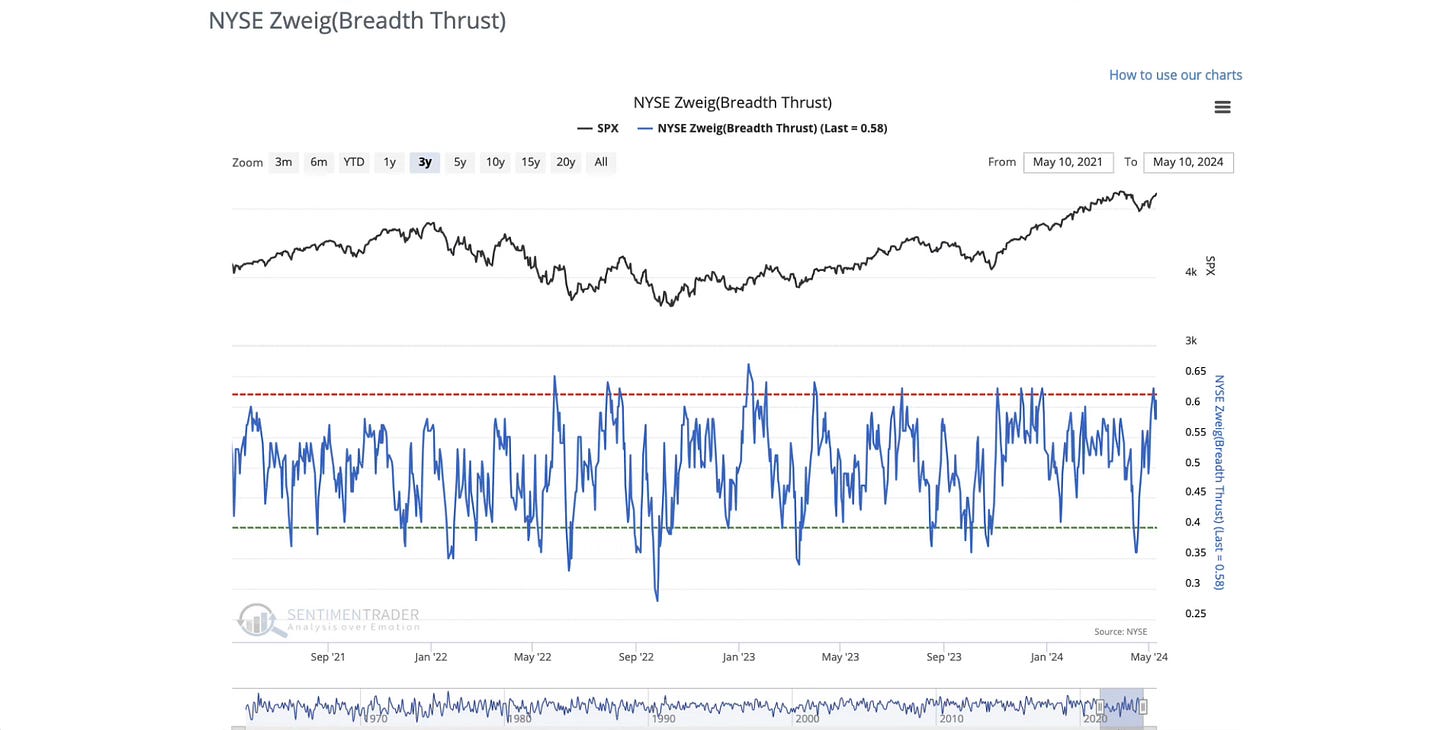
Here is what the current Zweig Breadth Thrust looks like:
While we don’t have a perfect trigger, we see that the recent move we’ve had has tremendous velocity and is a good sign moving forward.
For more analysis on this, watch the video below:


