Pullback or Correction?
Yesterday we saw a day of selling in the market. The selling began after economic data came out related to current accounts. I don’t think the data was anything to actually be concerned about but it provided investors a reason to protect themselves.
Let’s take a look at the indexes and what transpired.
Index Review
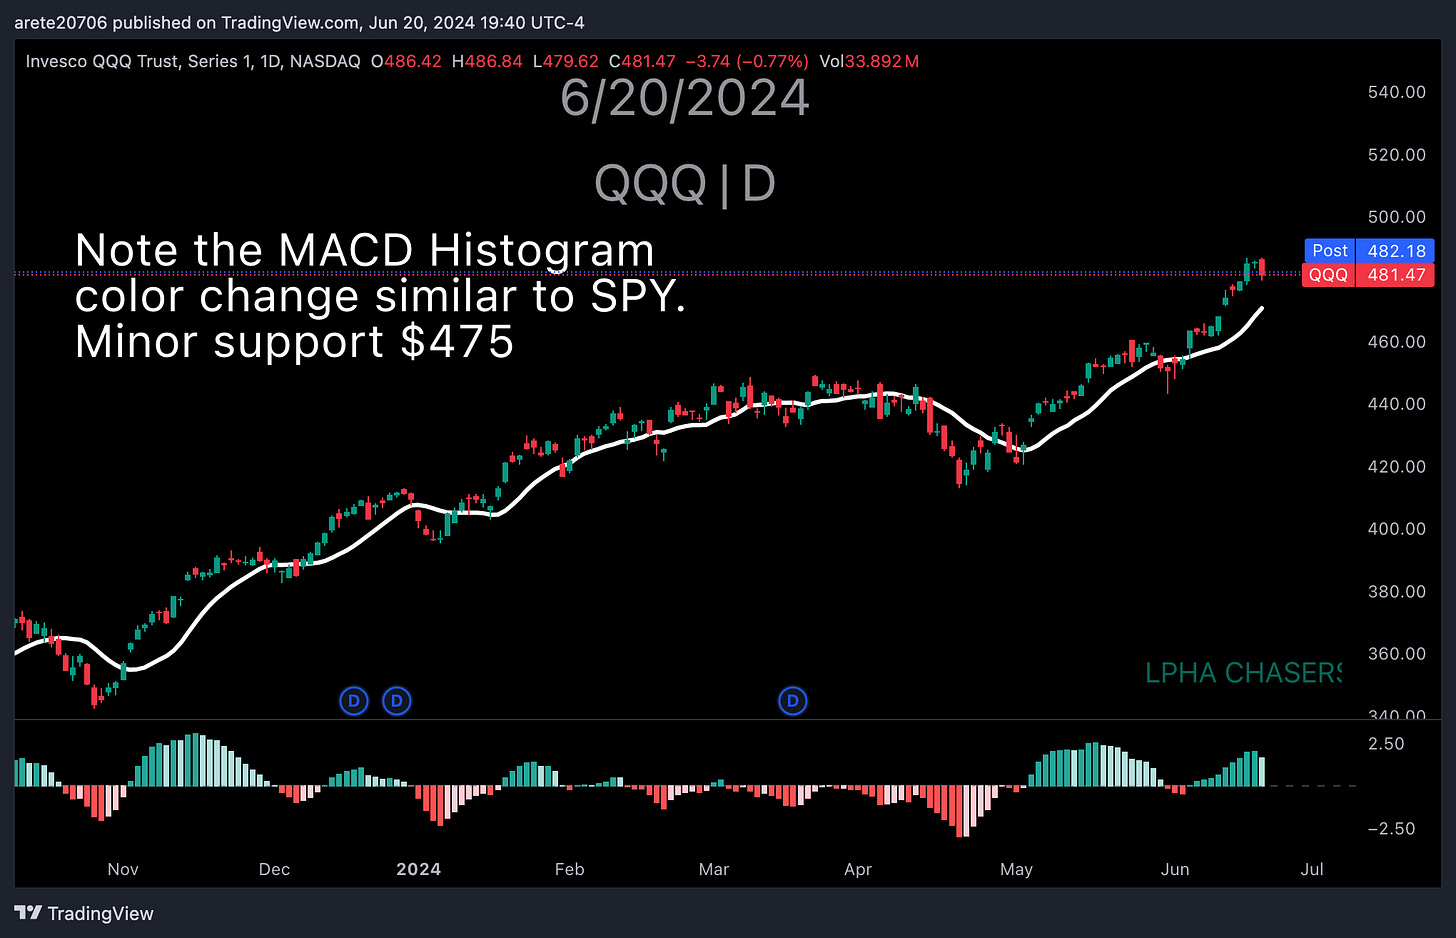
To spot changes in trend, I often use the MACD Histogram indicator. However I use it differently than most traders.
While most traders look for when the Histogram flips between green and red, I look for peaks and valleys within the green and red.
For example, today’s change from dark green to light green grabs my attention as a potential start of a short-term trend change.
If you look at each of the last few times we saw a change in color, you can see that it fairly accurately predicts trend reversals.
You can see the same thing happening in the QQQ.
Now to me this does not mean that we are due for a correction, but it means that we could have a short-term pullback or base for a while before moving higher.
In the video below I walk through how to read price action to improve your day trading skills:


