Index Review
Let’s start the week by doing a deep dive into the market indexes and what the outlook looks like going forward.
I’ll go through a few indicators that I think are particularly important to understand right now.
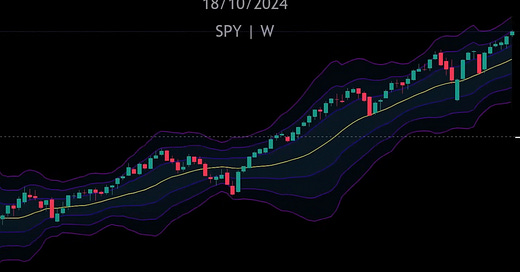
Starting with Bollinger Bands, we can see that even though we have seen six consecutive green weeks on the SPY, we are not at an extreme reading yet.
Something extreme would be touching the third standard deviation (the purple line at the top) which we have yet to do.
This tells us that we have room to run before reaching exhaustion.
Looking at some of the internals, we are starting to reach resistance levels on % of stocks above moving averages, specifically % above the 200 SMA (S5TH) and % above the 50 SMA (S5FI).
Looking at New Highs/New Lows, we can see that new highs continue to show an upward trajectory, while new lows are declining.
This again looks healthy to me. What would worry me is if we saw big spikes in new highs followed by significant pullbacks in new highs, representing uncertainty.
I hope this helps you orient yourself to start the week. For more analysis on the market and where we’re at, watch this:


