Smart Money vs. Dumb Money
If you watch my YouTube videos, you know that I often look at “Smart Money vs. Dumb Money” charts - or as I call them Institutions vs. Retail.
There are some correlations we see between how institutions and retail act and how the market moves.
I’ll show you what I’m seeing right now.
Retail Confidence Dropping?
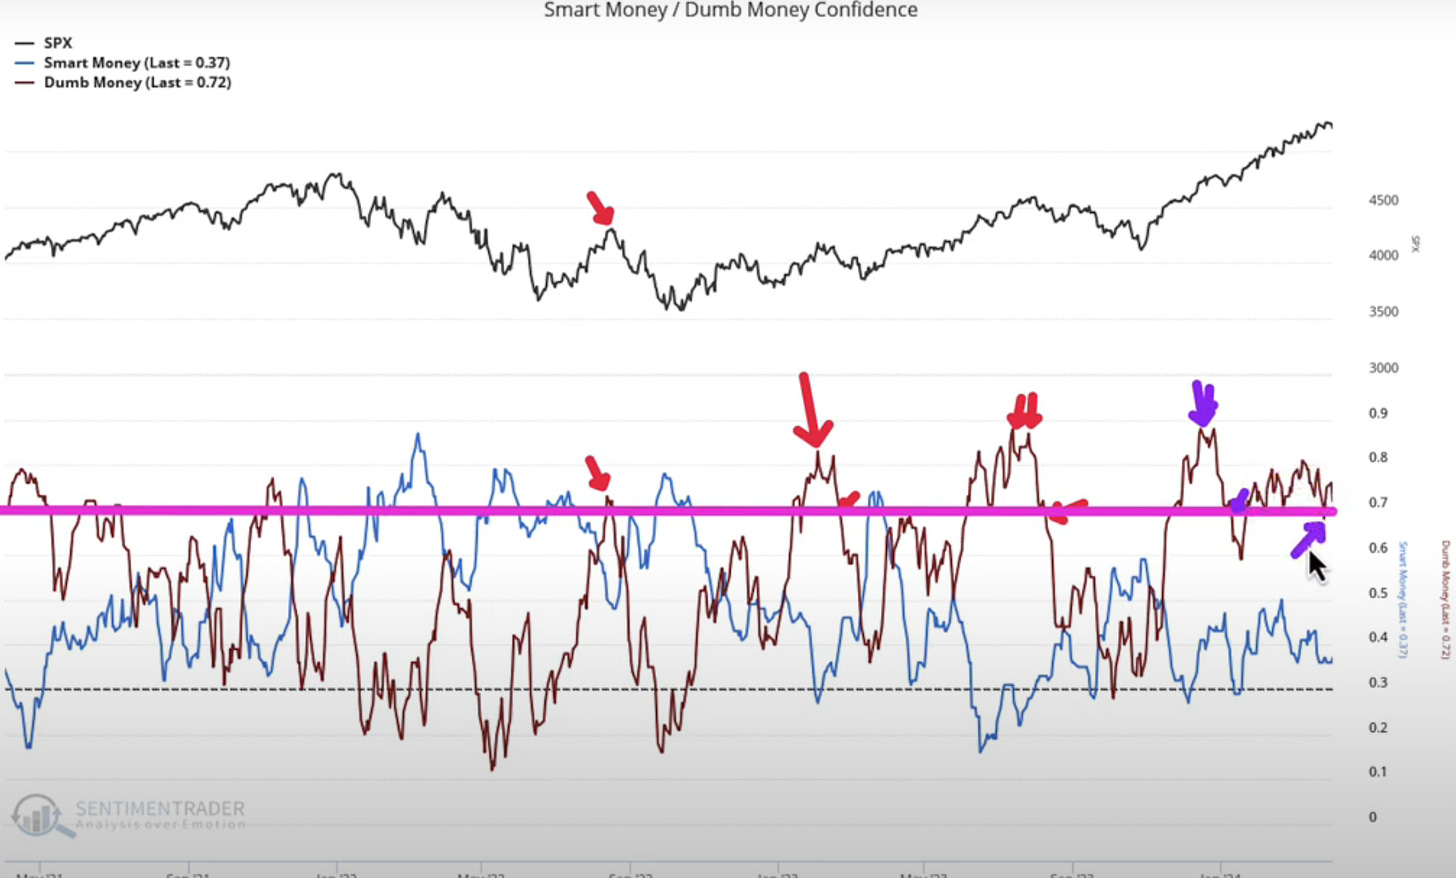
Look at the chart below. You can see where I marked off that when retail drops below the pink line (which is an extreme reading), we typically see a sell-off in the market.
Right now we are testing that level. I’m not crazy about the lower lows we are making, as it looks like we may break this level.
On the institutional side, they are underinvested and showing no signs of putting more money in the market at the moment.
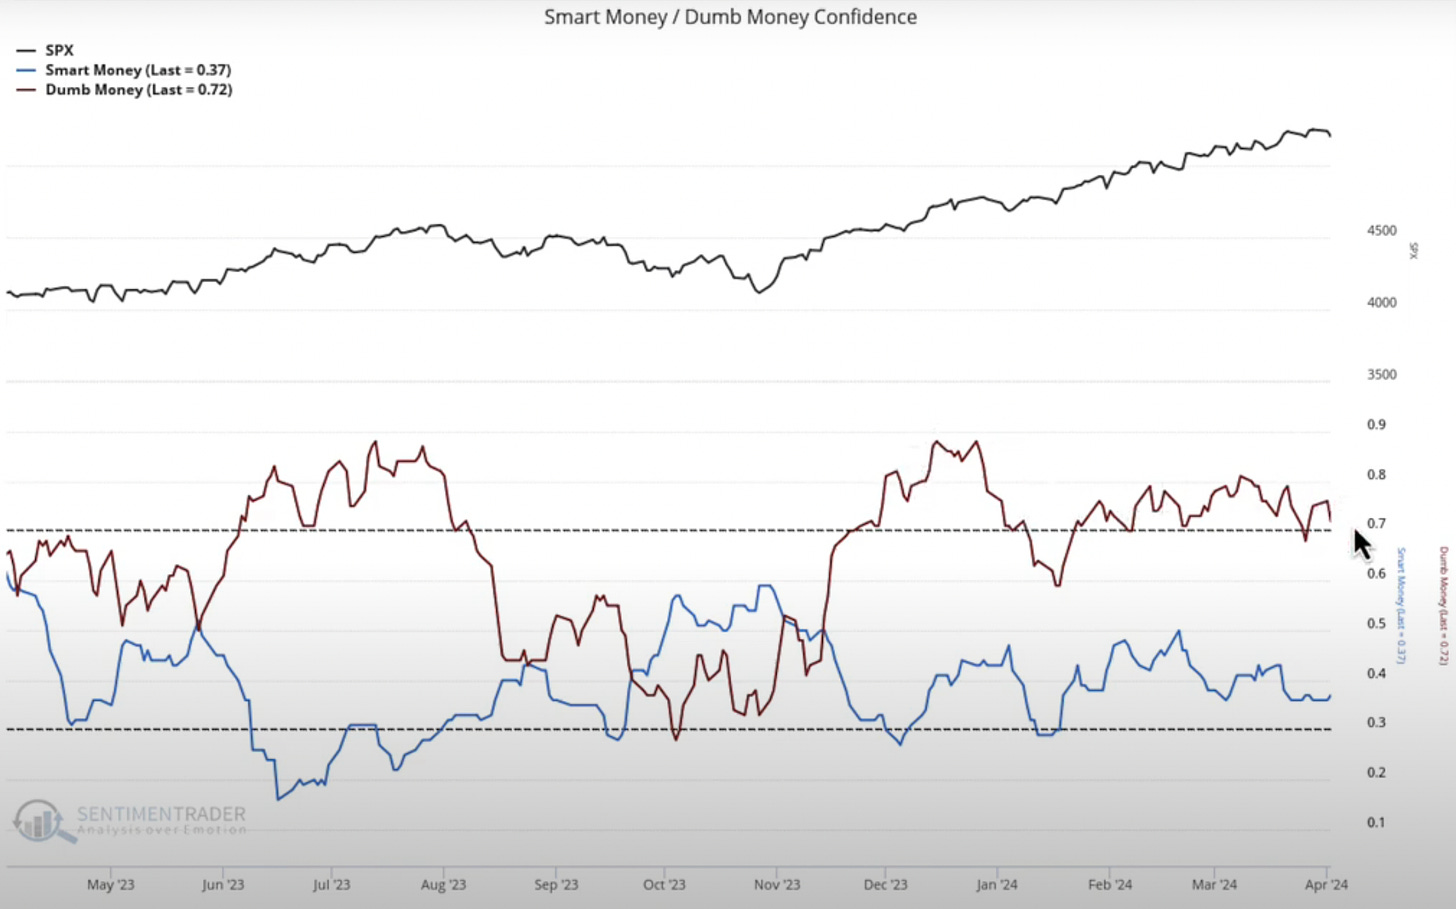
Based on the graph below which shows the same data over a longer timeframe, we are getting the same picture. Retail is forming a rounded top and looks to be breaking that 0.7 level.
Does this mean the market is due for a drop? No.
Does it mean this is something you should be keeping an eye on? Yes.
I share my full thoughts and how to take advantage of this data in the short clip below:


