Stock Market Bottom?
In this weekend’s YouTube video (link below) I walk through the indexes and some indicators that show us that we may have put a bottom in on the market.
I’ll briefly walk through some of those signs here.
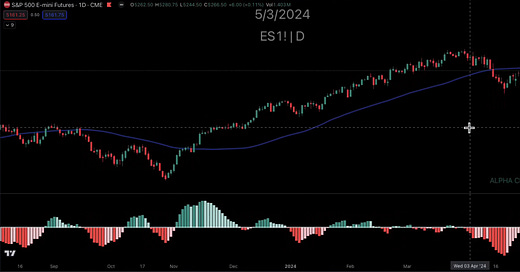
MACD Histogram
The MACD Histogram is an indicator that I look at often when looking for bottoms In the market.
I look at it differently than most people. Many like to look at when red flips to green and use that as a buy signal. I look for when red selling begins declining, flipping to light red. This is a good indicator of a short term bottom in the market.
You can see that we stopped dropping last week and are continuing to move higher (and we are even flipping green now).
This is a good sign for the market bottoming.
Equity Risk Premium
As a reminder, equity risk premium tells us how attractive stocks are vs. bonds. A higher equity risk premium signals that stocks are more attractive than bonds.
While we are still negative (telling us that bonds are more attractive right now), we have undercut the zero line and held support and look to be rising.
It is possible that this means we are bottoming out and will rise from here.
This is an indicator I will be watching very closely as the days and weeks go on.
Here is this weekend’s video where I dive into the market in much more detail and share more indications of whether we are bottoming or not.


