Market Internals
To get a really good sense of what’s going on with the stock market, let’s look under the hood at the following:
McClellan Summation Index
Advance/Declines
Stocks Above the 50 Day Moving Average
Looking at these will give us a clearer look at how the market is performing and what we can expect in the future.
McClellan Summation Index
From the image below, what we can surmise is that each time the McClellan Summation Index nears the 500 level and our indicator crosses to the downside, we typically sell off in the market.
Additionally, we can see that the spread is widening in our lines which points towards a continuation to the downside as well.
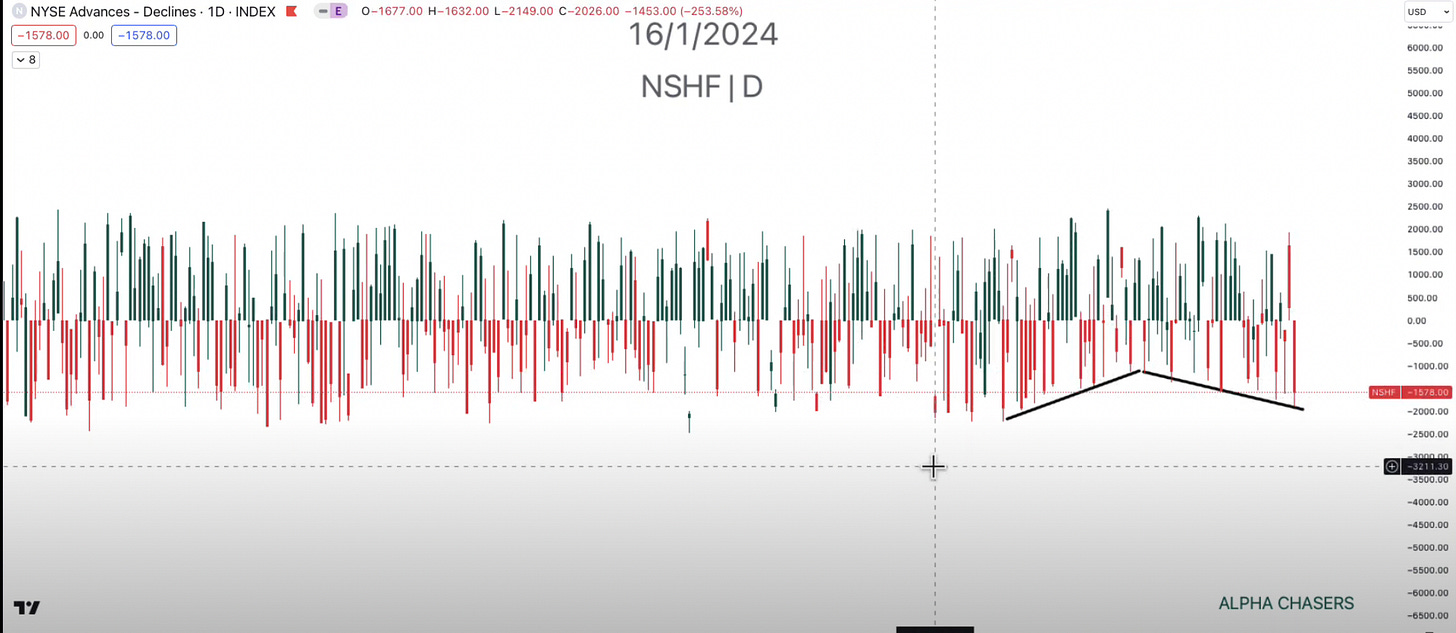
Advance/Declines
From the advances/declines we can see that we are at one of our highest rates of declines in the past year, which is concerning.
Additionally, we are seeing declines starting to significantly outpace advances which should give you pause.
Stocks Above the 50-Day Moving Average
From this indicator, the key takeaway is that when we hit about 90% of stocks above the 50-day moving average, we are typically due for a pullback.
When we break, we typically don’t find support until the number of stocks above the 50-day moving average hits 17%. We are rolling and have a long way down to go until we find support.
With this information in mind, it may be wise to tighten stops on positions and be cautious with entries. It doesn’t mean you need to stop trading.
For more information on the market, watch the video below:


Dude! Bright video is going to be the auto exposure on your camera. You can have one light or 7 lights and it can be either too dark or too bright if the auto-exposure is just off. Look for some kind of exposure setting on the camera and see if you can adjust it to minus one...or similar, if possible.