📈 The Future is not ..
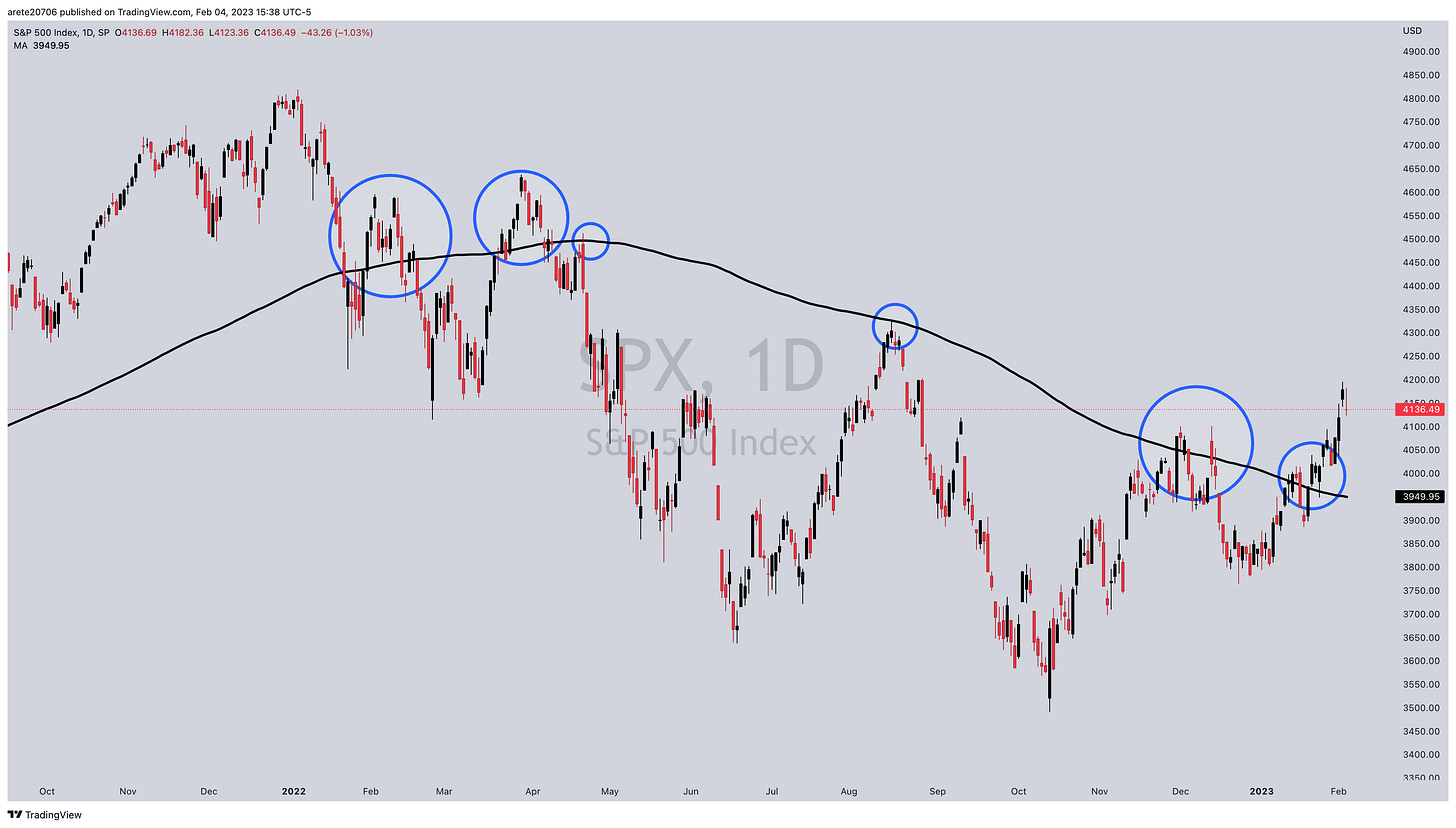
The future is not the past. The past can give us an indication on what to look for but there are no guarantees that the same outcome will happen. For example in 2022 to date the SP500 has broke above the 200 daily simple moving average 7 times. The first 5 resulted in new lows.
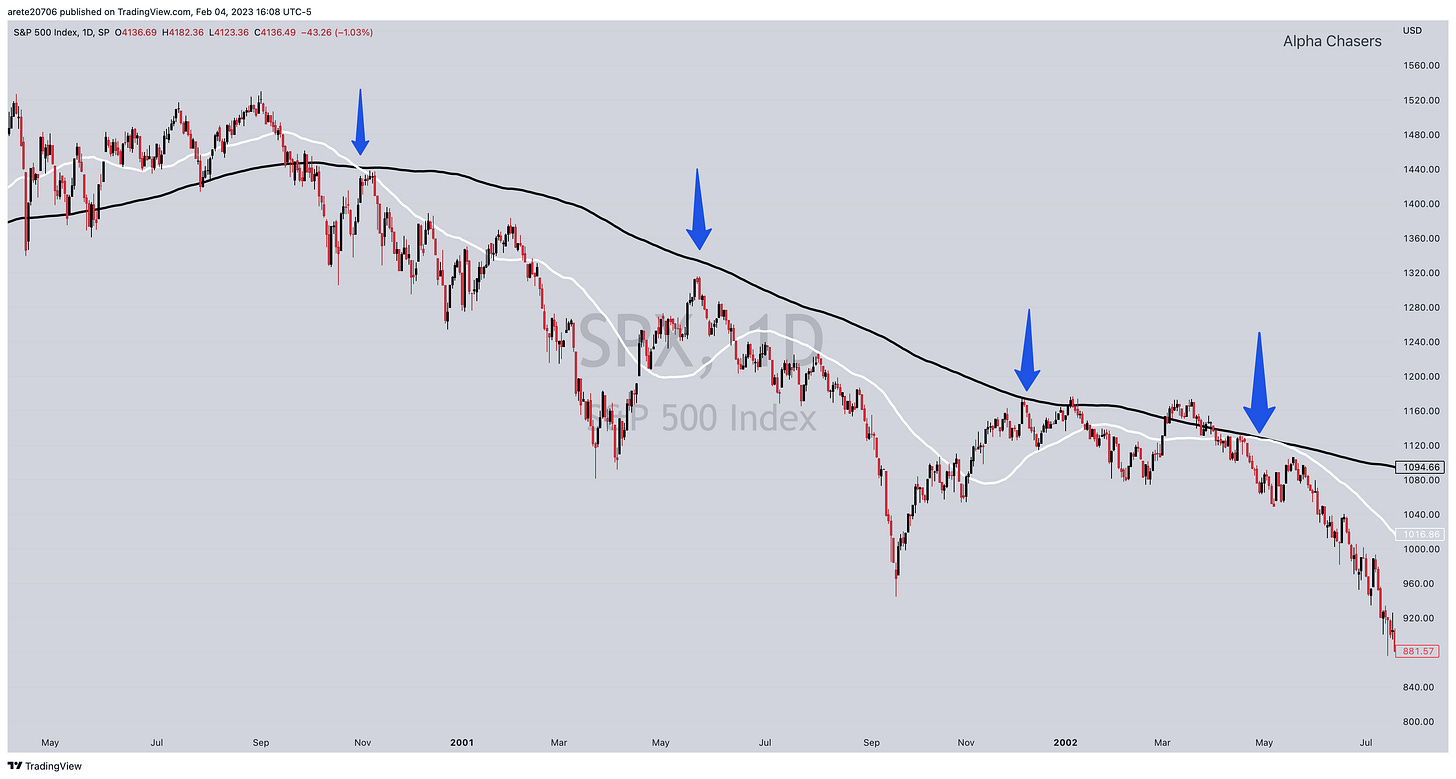
As the saying goes “ The trend is your friend until the trend ends.” The question is: Are we able to spot a shift in trend. The answer is yes. It’s possible to look at several indicators and see how many align. The more that align the greater the probability of being correct. For example the SPX recently bounce 20% off of its lows. A comparison is being made to the 2001 correction where we rallied twice from lows over 20% only to bounce back down. (See 2001 below)
Now there are several technical patterns and indicators that are very different than 2001 and the great financial crisis . Let’s focus on moving averages. Below the 200 SMA(simple moving average is in black and the 50 SMA is in white. Note how we were unable to get above the 200 SMA and the 50 SMA could not get above the 200 SMA in 2001.
Note in 2002 and beginning 2003 how we flipped to higher lows and and higher highs. Very subtle yet its there. Almost as if in disbelief that the carnage is over. I know I was at the time. I was still bearish in 2003 That was a lesson I learned. Opinions do not matter only what happens does. Eventually the 50 SMA crossed the 200 SMA to the upside resulting in a pattern called a golden cross.
A golden cross is one of the most powerful longer term bullish signals we have had in the past 40 years of backtesting the pattern. I went back to 1980 and looked at the performance of every golden cross. Here are two facts. 1. A golden cross has consistently marked the bottom of every bear market. 2. The period of a golden cross through the net 12 months outperforms the historical average of the SP500 . Below is a golden cross marking the end of the great financial crisis.
Here are three more examples of the golden cross. 2018 correction, the pandemic and now.
To negate the pattern we need a death cross which is the 200 SMA crossing the 50 SMA to the downside. This usually takes several months on average. The future is not the past. Past performance is tool to determine probabilities about the future. remember no one is going to ring a bell at the bottom. Well maybe someone. Ding. Ding.
Watch the video below for an extensive overview of stocks that are on my buy list for next week.
“Those that fail to learn from history are doomed to repeat it.” Winston Churchill
Alpha Chasers Community Waitlist Click Here
1 on 1 Coaching Program Click Here
Wishing Everyone Massive Success in 2023 🍾


