The State of the Market
As we reach new months, it is a best practice to take a look at key stocks and indexes to see what monthly charts look like.
It can be beneficial to zoom out from the typical daily charts we look at to understand where the market is longer term.
Let’s take a look.
S&P 500
From the chart below, we can see that in January, we retested previous highs and then made a new high.
Although February is only a few days into the month and the candle is far from closed, we have already made a higher high which is promising.
The break and retest in January is promising with increasing volume.
Nasdaq
We are seeing a similar pattern on the Nasdaq. We broke above previous highs, retested resistance which has now turned to support, and are looking to make a higher high this month.
Note that we are nearing the 70 mark on RSI which will be key to watch. Just because RSI is high does not mean that we cannot move higher.
For example, look at how long we remained over 70 RSI - essentially for all of 2021 and the market ripped.
Russell 2000
We can see that from a relative perspective, the IWM (small caps) are clearly the weakest index.
We are nowhere near all-time highs and are struggling with the same resistance level we have been bonking on for the past year.
We are seeing increasing volume so this will be important to see whether we’re able to finally break this level or reject.
Sector Comparison
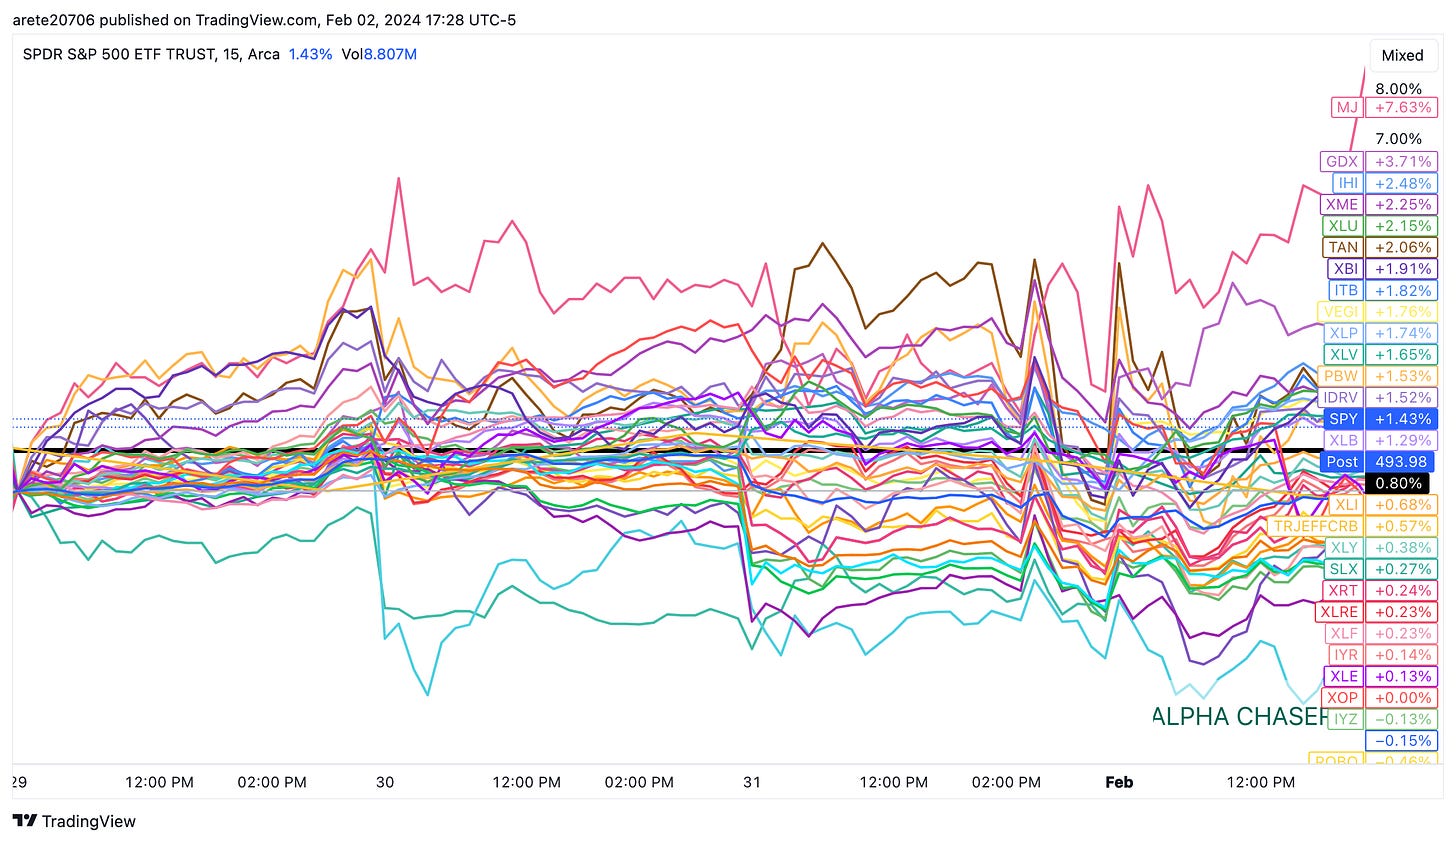
Let’s take a look at which sectors have performed the best this past week to understand where money may continue flowing next week:
Top sectors of the past week:
MJ - Alternate Harvest (marijuana) ETF
GDX - Gold Miners ETF
IHI - Medical Devices ETF
XME - Metals & Mining ETF
XLU - Utilities ETF
For more stock market analysis, watch the video below:


Great analysis. Thank you, mentor.
Also, I want to express my appreciation for sharing your experience. I am truly consider you are one of the best best.