📈The Week in Stocks in 20 Charts
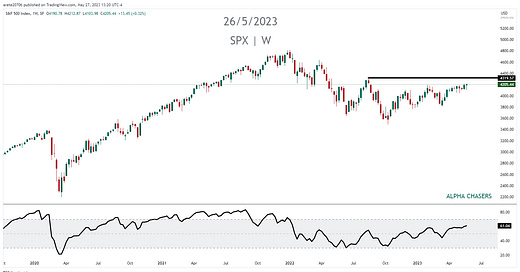
What a week for the bulls! The SP500 closed at a 9 month high and the third highest close in the past 52 weeks. Nasdaq made another new 52 week high as the semiconductor index broke out. Its hard to understand how traders can be bearish with earnings beating and exceeding expectations. What we are witnessing is winners and losers in the market. The rally is not being driven by the federal reserve dumping trillions of dollars in equities and bonds. This means the moves will be driven the majority of the time by the companies performance. Most newer traders are not familiar with the stock market before 2008 and the zero interest rate environment. Stocks were driven by revenue and earnings growth. Comparison to their performance over their peers plays a role as well. We are seeing that market take shape again.
SP500 (SPY) with the 3rd highest close in 52 weeks. RSI above 50 for the longest time in 18 months.
Nasdaq (QQQ) another new 52 week and the RSI breaking above 70 which signals massive swings are likely.
Russell 2000 (IWM) continues to underperform due to regional banks making up 15.9% of the index. RSI continually under 50.
Semiconductor Sector (SOXX) with a massive breakout on the NVDA and MRVL earnings news. A test of the highs is setting up.
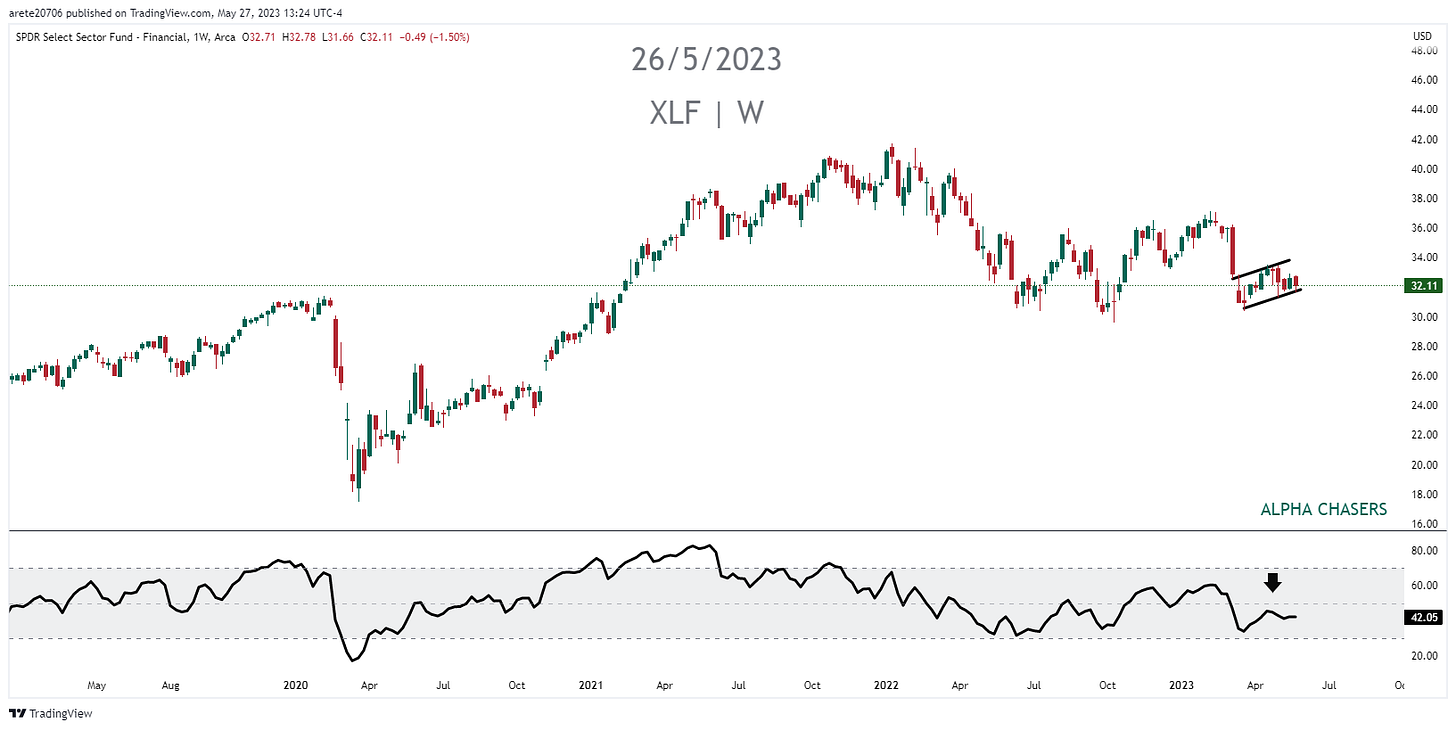
Financial (XLF) sector is troubling. It is hard to sustain a rally without financials at least stable. Bear pendant and RSI under 50.
NYSE (NYA) with McLellan Summation tried to flip into a cross and failed. Note the action of the NYSE on the crossings.
SP500 (SPY) New highs New lows are similar to the wash out in 2008-2009
Nvidia (NVDA) crushed expectations and raised guidance to unpreceded levels. Clear breakout RSI is insanely high so a pull back can happen.
Broadcom (AVGO) reports Thursday. All time highs ahead of reporting.
Salesforce (CRM) earnings this week. RSI shaping up. Resistance $221.50
Tesla (TSLA) has been a laggard but note the downward trend channel and the RSI attempting to get over 50.
Lam Research (LRCX) is a supplier to NVDA. New 52 week high. RSI breaking out above 70.
Taiwan semiconductor. (TSM) 52 week high and getting ready to test the $107.50 neckline.
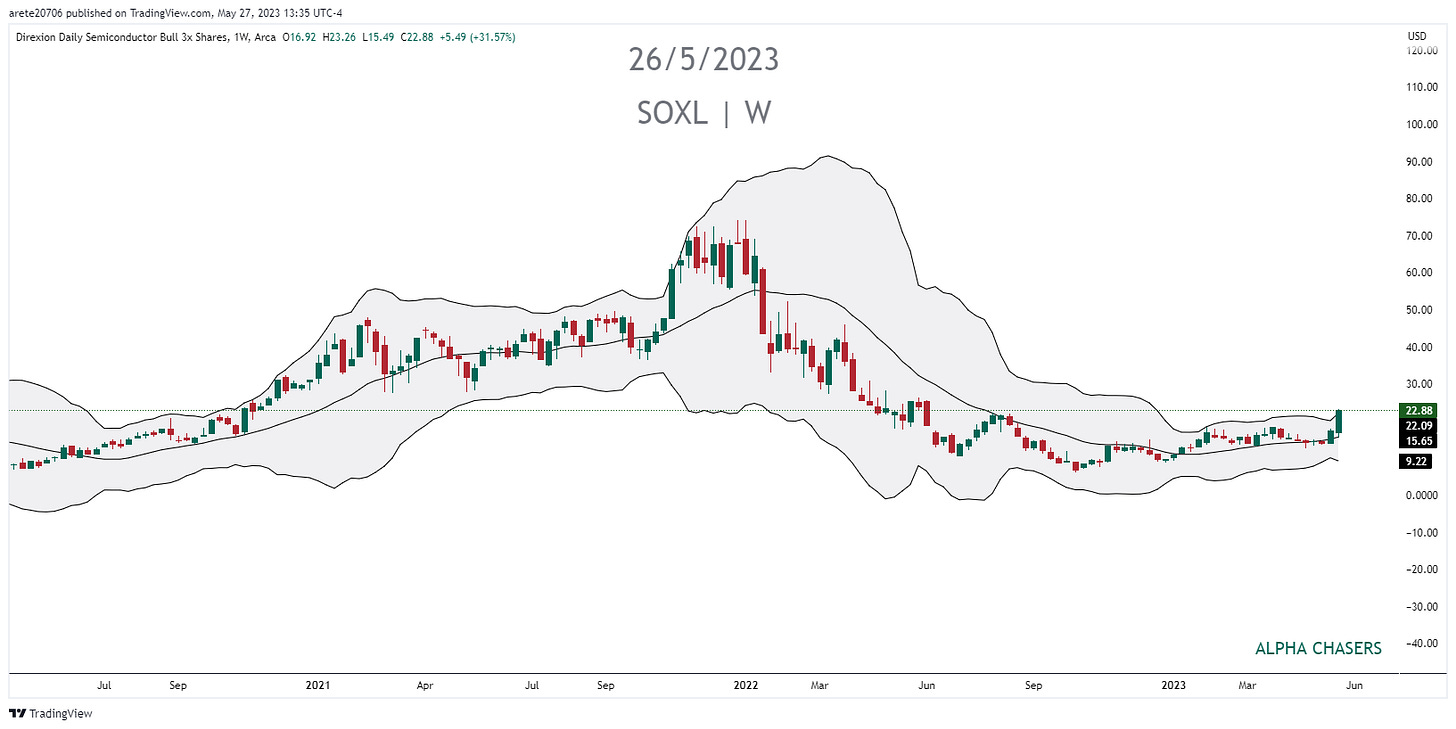
SOXX 3x ETF (SOXL) massive move through the 3rd standard deviation of Bollinger bands. It usually lead to long term higher prices but short term pullbacks. a 3rd std. dev. move is extremely rare.
Energy (XLE) lower highs and the RSI has a massive negative divergence.
10 Year Treasury (TNX) Bonds being sold as the June Fed meeting looks less uncertain. 3.25% continues to be major support.
Fed Rate Hike Probability increased after a higher than expected PCE reading.
Money Market Flows are picking back up. This is bearish for regional banks. (KRE)
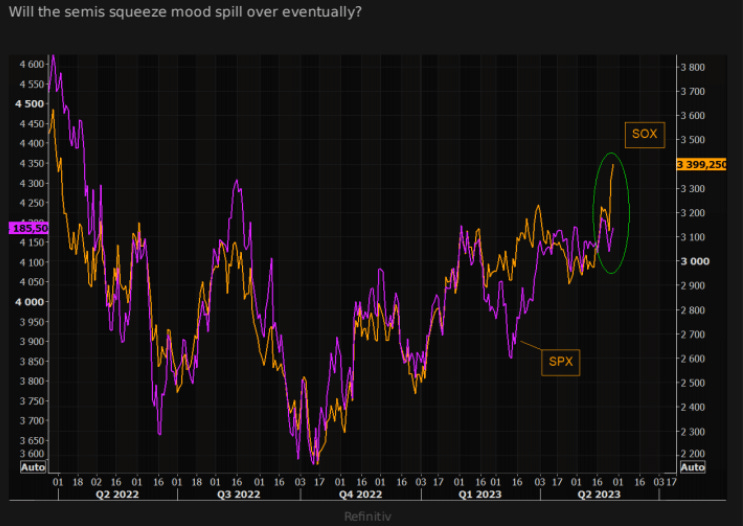
SP500 has been mirroring the SOXX per Refinitiv. Its worth noting and is indicative of why SPY moved on Friday on the semi news versus selling off on the PCE news.
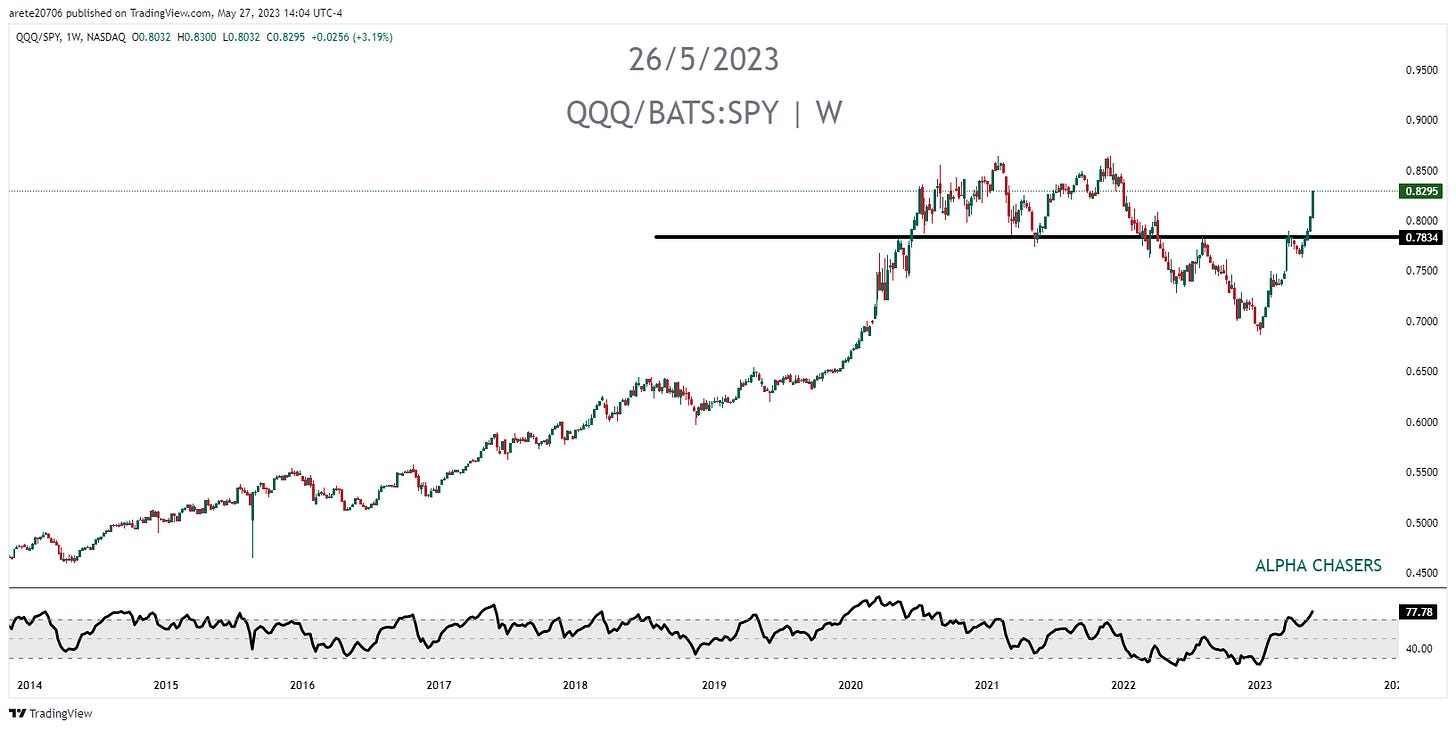
Nasdaq relative to the SP500 continues to outperform. This is bullish for equities.
Watch this video for a detailed look into what to expect next week. Pay close attention to the comments on AVGO and CRM earnings next week.
Wishing Everyone Massive Success!

