Market Breadth
Breadth is extremely important to the market. In a healthy market, we have strong breadth, meaning that the market is being propelled by not one single sector, but many sectors are rallying simultaneously.
When we start to see breadth thin out and the market is being held up by a select few stocks, we should be cautious as this may signal a sell-off is coming.
I have some data that gives us an indicator of market breadth right now.
Watch This Signal
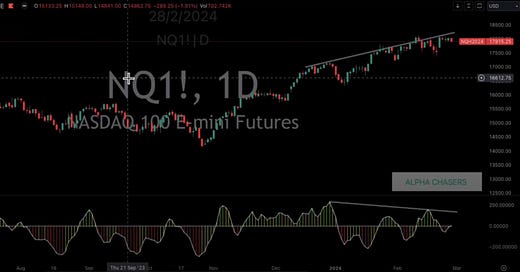
The indicator on the bottom of the chart below is a summation of market breadth across the major indexes in the market.
We can see that when breadth is low, we typically see sell-offs, and we have good breadth, the market typically moves higher.
Something concerning to me is that despite the fact that we are moving higher in the market, we are seeing breadth decrease. This is shown by the lines indicating a negative divergence between market performance and market breadth.
Now this does not mean that the market is going to crash or that you need to sell of your positions immediately. This is one indicator out of a number that you should be using to understand the health of the market.
I walk through the indicator and my take on it more in-depth in this short clip below:


