📈What Happened In Stocks in 20 Charts
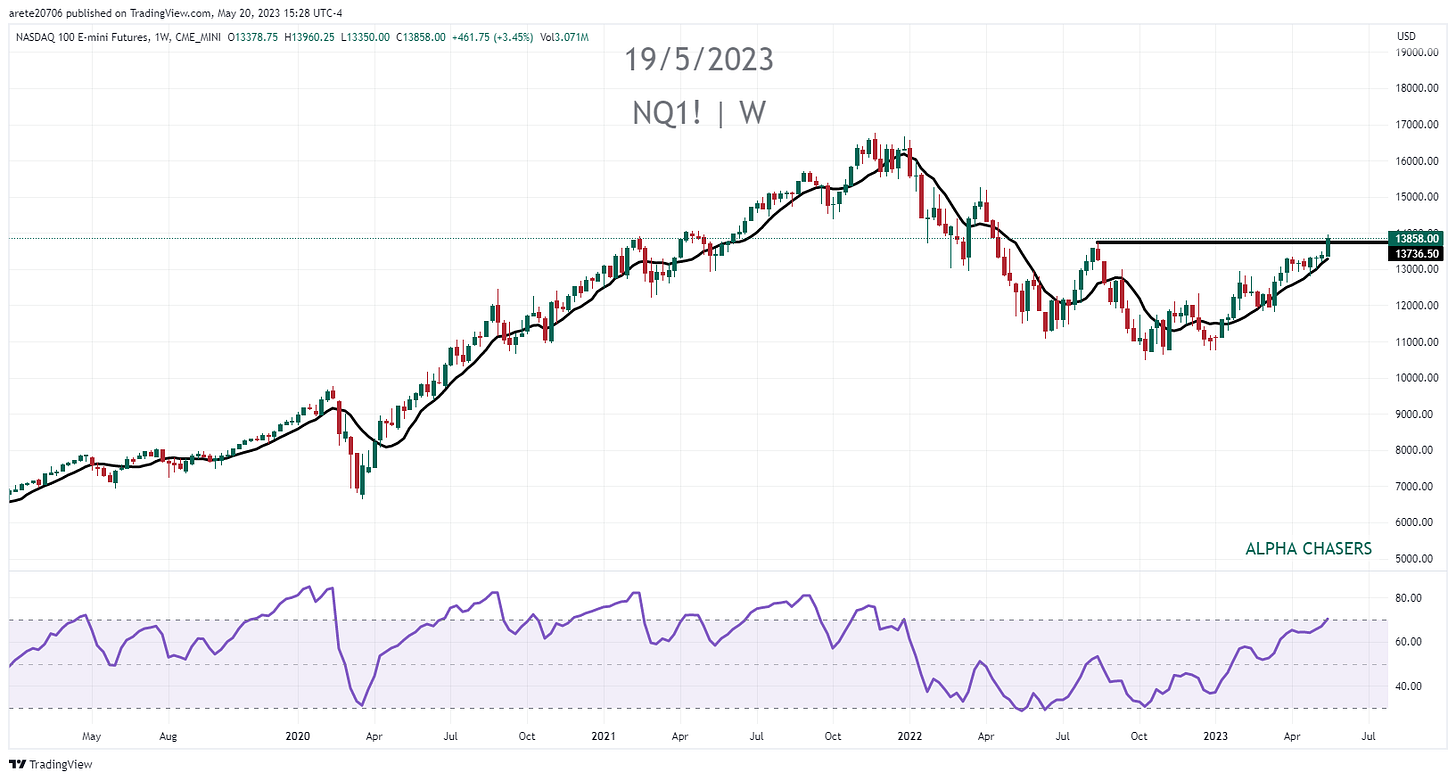
Wild week in the stock market with the Nasdaq breaking out to a 52 week high. Specifically technology names are seeing the most inflows of capital. The two main subsectors are Semiconductors and Communications services. As the market gets stronger we are broadening out. This is a good long term signal. While are may have gotten a little ahead of ourselves overall we are seeing very constructive bullish price action for the bulls.
SP500 New 9 month closing high on the weekly and the 22 SMA is now ascending.
Nasdaq New 52 week high and nine weeks above the 9 EMA which has not been done since June 2021.
Russell 2000 (IWM ) single greatest buying volume since Oct 2022. $170 is major support.
Russell 200 Value (IWN). First higher high close on the weekly chart since Mid March
Growth (VUG) relative to Value (VTV) stocks. We see growth continue to outperform and even clear the neckline.
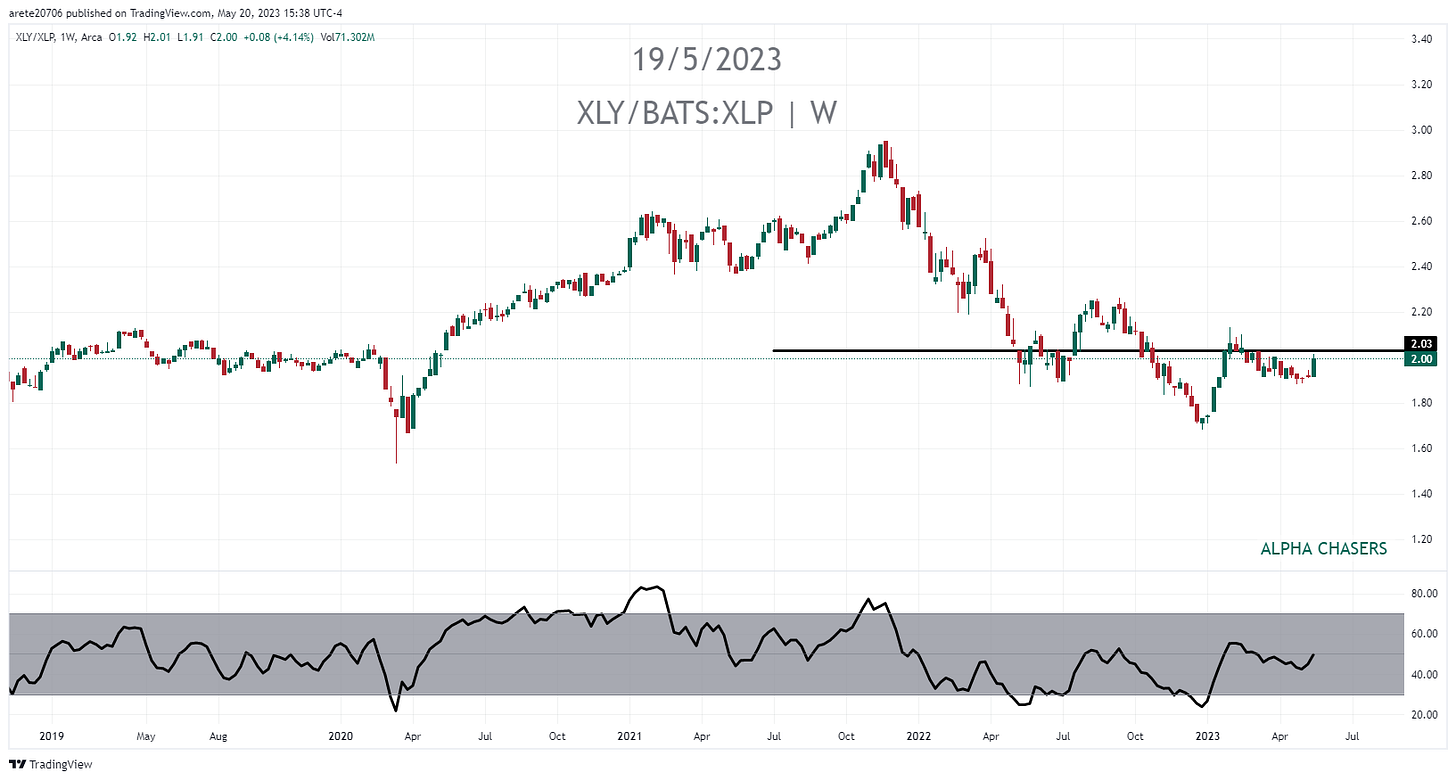
Consumer discretionary (XLY) relative to Consumer staples (XLP). Wants versus needs. When XLY outperforms it is bullish for equity prices.
SP500 (SPY) relative to Technology (XLK). We are going to look at this chart two different ways. Looking at the chart below It would be clear that this may take out new lows.
XLK / SPY When we look at it from technology outperformance of SP500 we see a breakout but what we hear is that this is unsustainable. I have let the chart tell me what is sustainable instead of me telling the chart and it has worked out nicely.
Semiconductor index weekly close was above the $440 level and the 10th straight weekly close above anchored VWAP from the November 2021 high.
Tracking words used in conference calls can tell you a lot about how companies view a subject matter. The word recession peaked in 2Q 2002 and has been dropping considerably since. (Data by Factset )
There has been a 64% increase Year over Year of “AI” mentioned on conference calls.
Nasdaq 100 earnings uptick versus SP500 earnings for the first time in over 18 months
Global equities are seeing more inflows than domestic per Goldman Sacs.
Japan (EWJ) is seeing a resurgence in investment demand. Real wage growth increased 3.6% versus last year. This is the first time in decades after a long battle with disinflation.
Communication services (XLC) made a new 52 week high. This is a leading sector of the SP500. Main components are META GOOG NFLX
Netflix (NFLX) added 5 million subscribers to its new ad tiered program. This is significantly higher than expected. Second highest weekly close in a year.
Nvidia (NVDA) has been a massive winner since the beginning of the year. Earnings are Wednesday. New 18 month high.
Dollar (DXY) attempting to hold parity. It could retest $105.
Copper with a break of the 55 SMA weekly. At this stage in the inflation cycle we usually see basic material, commodities and energy drop.
IPO’s are at a 10 year low but the IPO ETF touched the 55 SMA weekly for the first time since November 2021.
Nasdaq (QQQ) continues to breakout relative to the SP500 (SPY). The Nasdaq leading is bullish.
Watch this video for an very detailed look at the SP500 and Nasdaq as well as the largest stocks set to lead the AI craze.
Wishing Everyone Massive Success!


