📈What Happened in Stocks in 20 Charts
Last week we received a ton of economic data that shows clearly that inflation is coming down.
CPI and PPI data was as follows:
CPI Core Inflation Rate MoM OCT 0.2% actual 0.3% estimate
Core Inflation Rate YoY OCT 4% actual 4.1% estimate
Inflation Rate MoM OCT 0% actual 0.1% estimate
Inflation Rate YoY OCT 3.2% actual 3.3% estimate
Core PPI MoM OCT0% 0.2% 0.3%
Core PPI YoY OCT 2.4% actual 2.7% estimate
PPI YoY OCT 1.3% actual 1.9% estimate
PPI MoM OCT-0.5% actual 0.1% estimate
Based upon the CPI and PPI release the chances of a rate hike plummeted. The chances of a rate hike on December 13th were 29.9% 30 days ago. Now they are .2%. This is a dramatic shift and will cause major asset class restructuring. Let’s Look at the charts!
Apple ($AAPL)
Crude Oil Futures (CL1!)
Dow Jones Industrial Average ($DIA)
US Dollar Index ($DXY)
Google ($GOOG)
Russell 2000 ETF ($IWM)
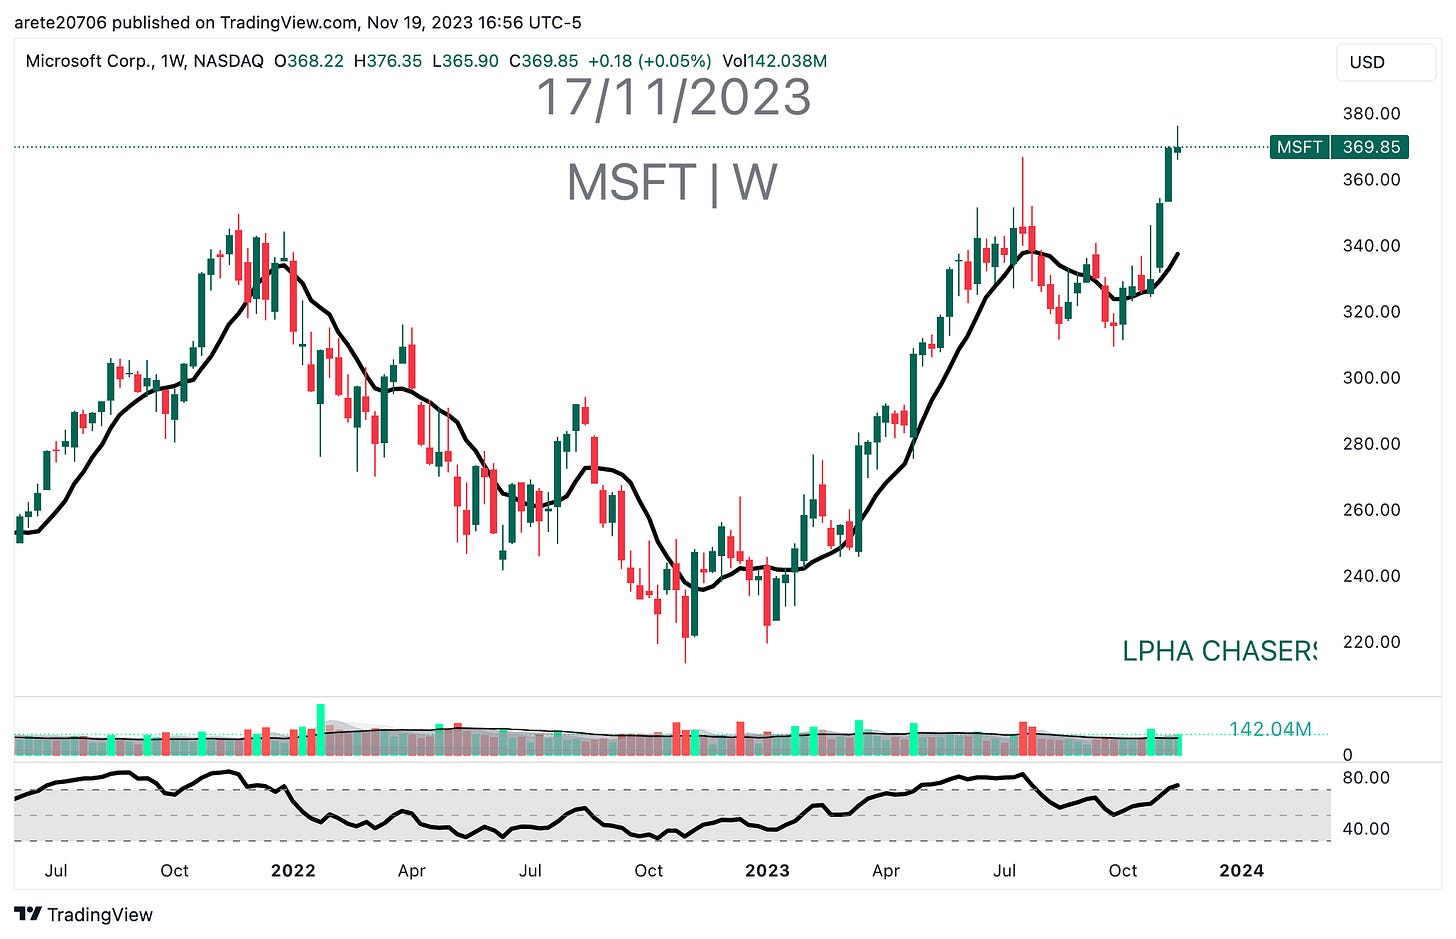
Microsoft ($MSFT)
Netflix ($NFLX)
Nvidia ($NVDA)
Nasdaq 100 ($QQQ)
Semiconductors ETF ($SOXX)
S&P 500 ($SPY)
Tesla ($TSLA)
Taiwan Semiconductors ($TSM)
Financials ETF ($XLF)
S&P 500 market cap concentration in top 7 stocks
The “Magnificent 7” have lifted the S&P 500 in 2023
Percent of S&P 500 companies beating quarterly EPS and sales estimates
Housing vacancy rates
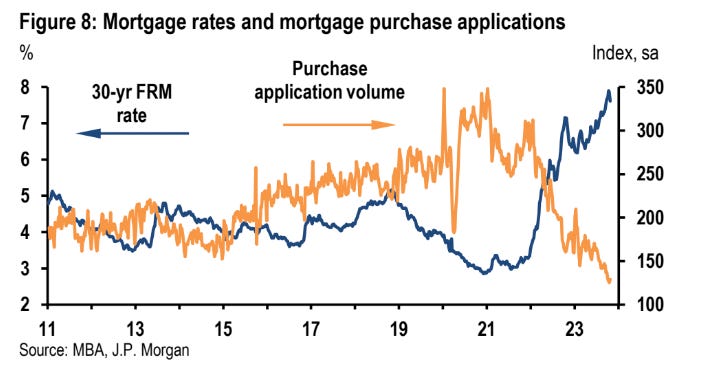
Mortgage rates and mortgage purchase applications
Watch this video for a look at 4 indicators that all gave major signals in the past week. The last time this happened was the late 1990s


