📈What Happened In Stocks in 20 Charts
Indexes finished the week down after a massive sell-off on disappointing earnings. ASML and TSM both reported and had a massive effect on the semiconductor stocks. While both quarters were good, they stated that they expect slower growth in the second half of the year. ASML's issue is capacity constraints, while TSM's issue is legacy chips and the uncertainty of whether inventories will be replenished. Netflix's revenue number was lower than expected, and their cost to acquire new subscribers was significantly higher than expected. Tesla's earnings were in line, but the free cash flow and future price cuts spooked investors. Overall, the selling could have been much worse across the board. We have 40% of the S&P 500 reporting this week, as well as the Federal Reserve meeting, so investors may look to lock in profits ahead of this. The one thing we are certain of is that the volatility will be high. Let's look at the charts. Key Levels are market on the charts.
SP500 ($SPY)
Nasdaq ($QQQ)
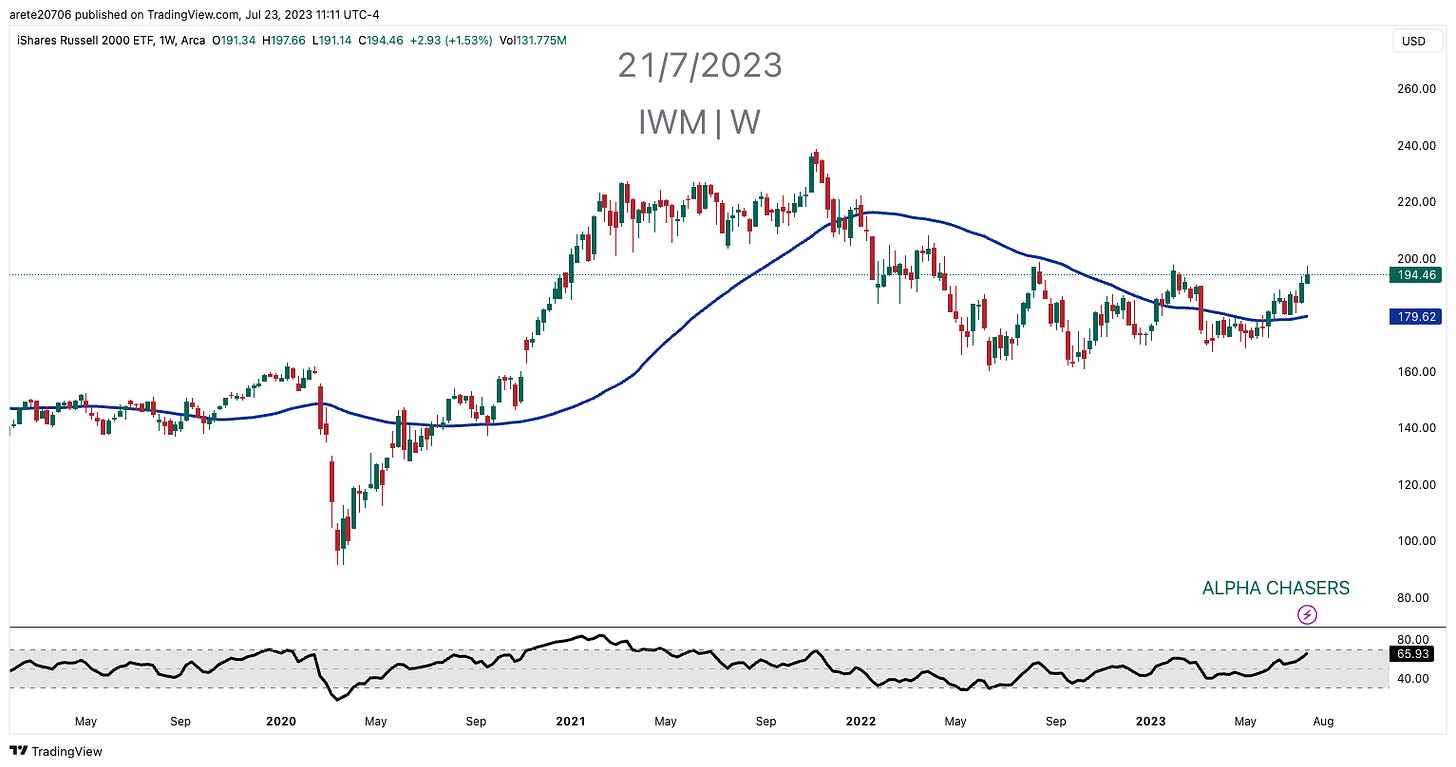
Russell 2000 ($IWM)
Semiconductor Sector ($SOXX)
Financial Sector ($XLF)
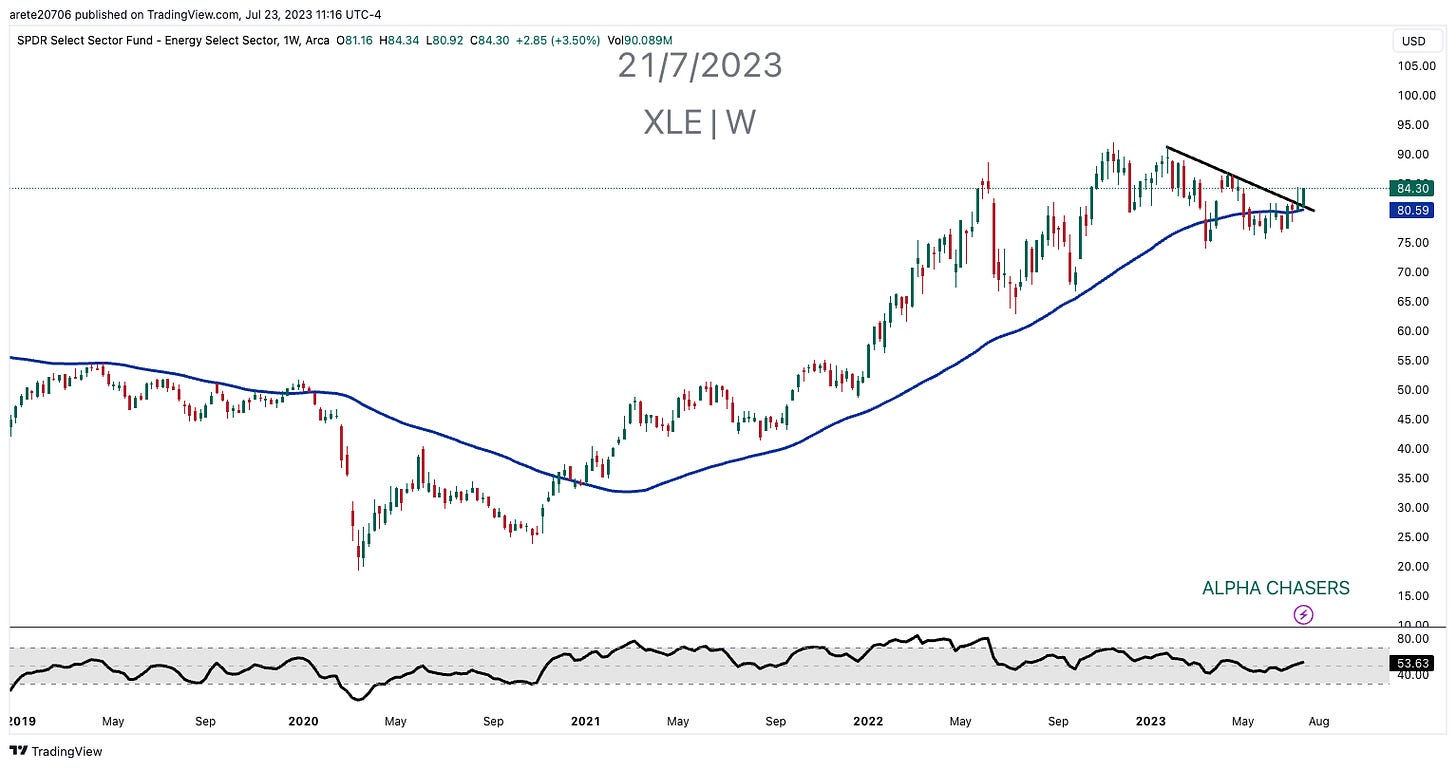
Energy Sector ($XLE)
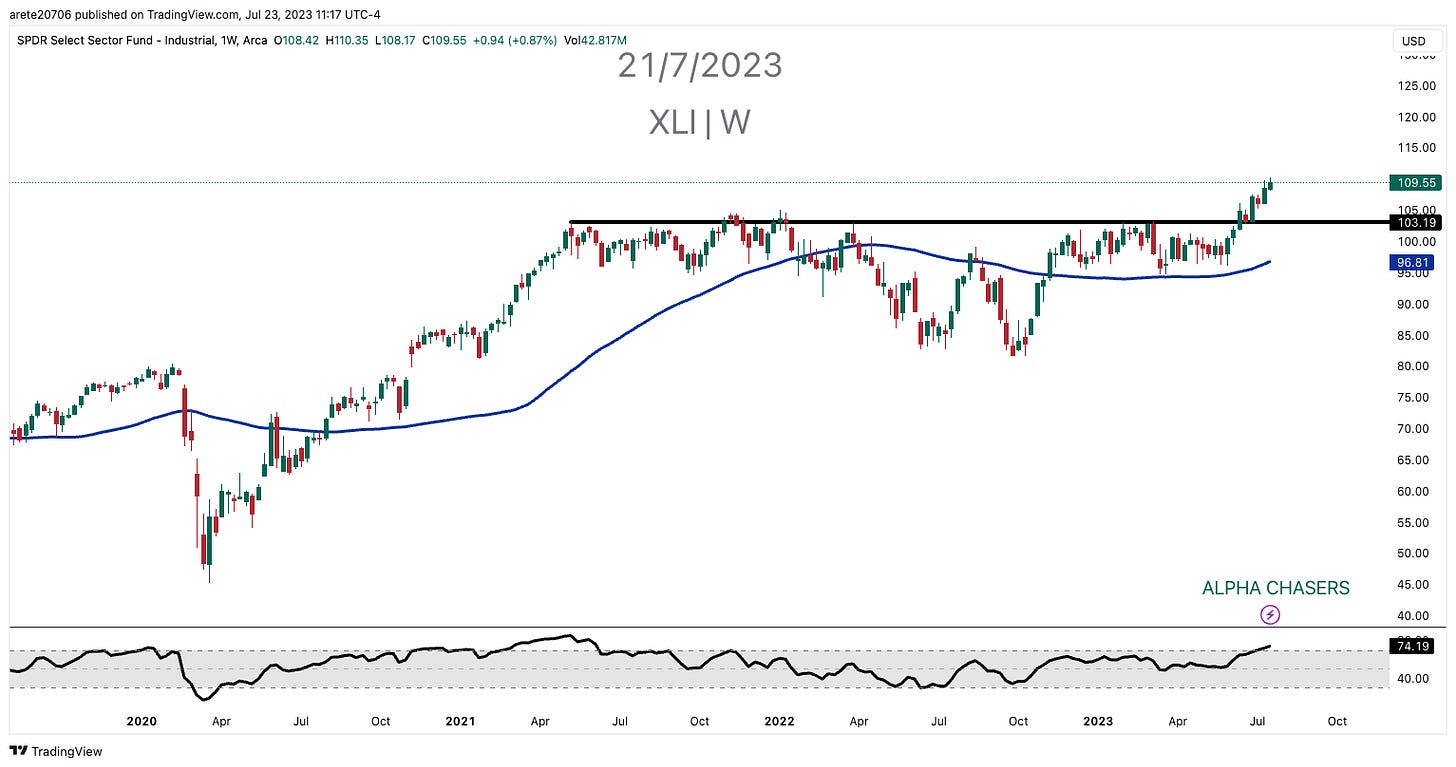
Industrial Sector ($XLI)
Tesla ($TSLA)- Blue line is rate of change
Wants versus Needs ($XLY/$XLP) inverted head and shoulder
Apple ($AAPL) gravestone doji
Nvidia ($NVDA)
Netflix ($NFLX)
Microsoft ($MSFT) blue line is rate of change
Value versus Growth ($VTV / $VUG) reversal
Existing Home Sales dropping as inventory dries up but New Home Sales increase. (XHB)
Millennials predicted to be the driver of home sales.
China #CPI heading towards deflation
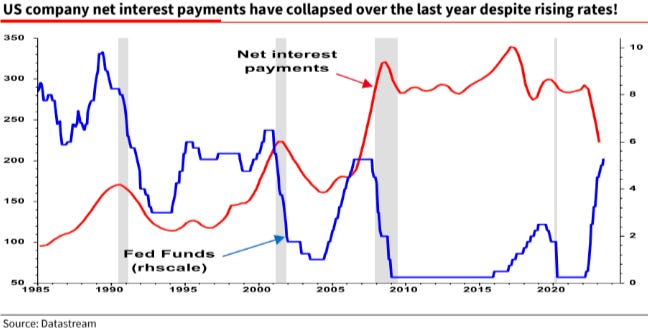
U.S. company net interest payments are collapsing which drives net profit.
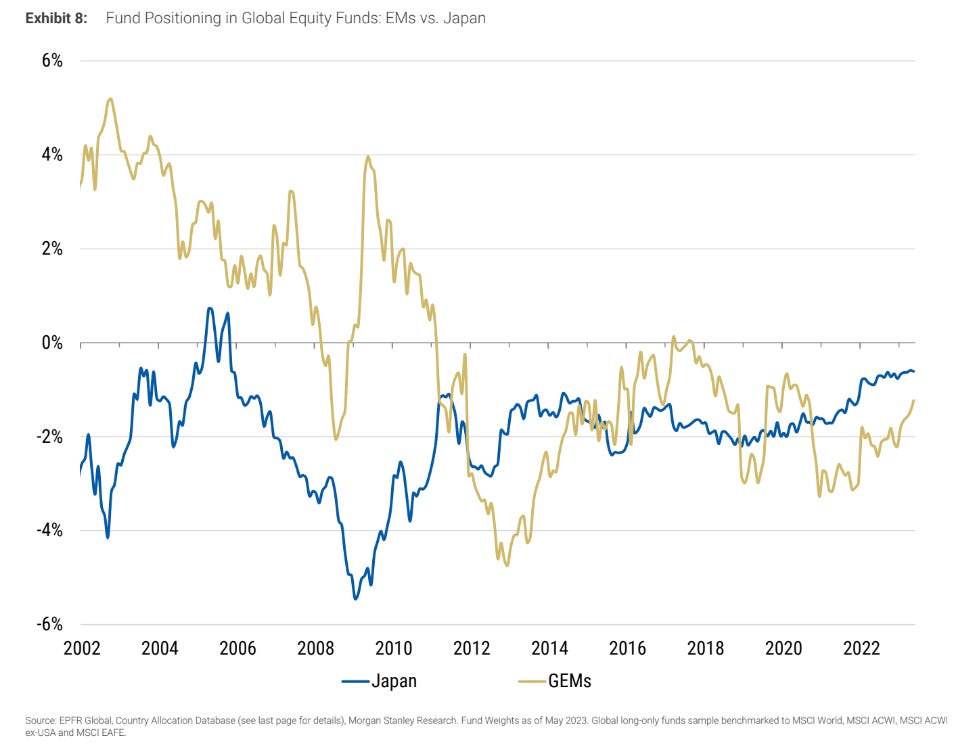
Japan (EWJ) overtaking all Global EMs for positioning.
U.S. Inflation set to implode which makes sense if you consider the majority of exports came from China.
Watch this video for what sectors are set to break out and what sectors are starting to roll over. Pay close attention to the technology sector key levels.
Wishing Everyone Massive Success!


