📈What Happened In Stocks in 20 Charts
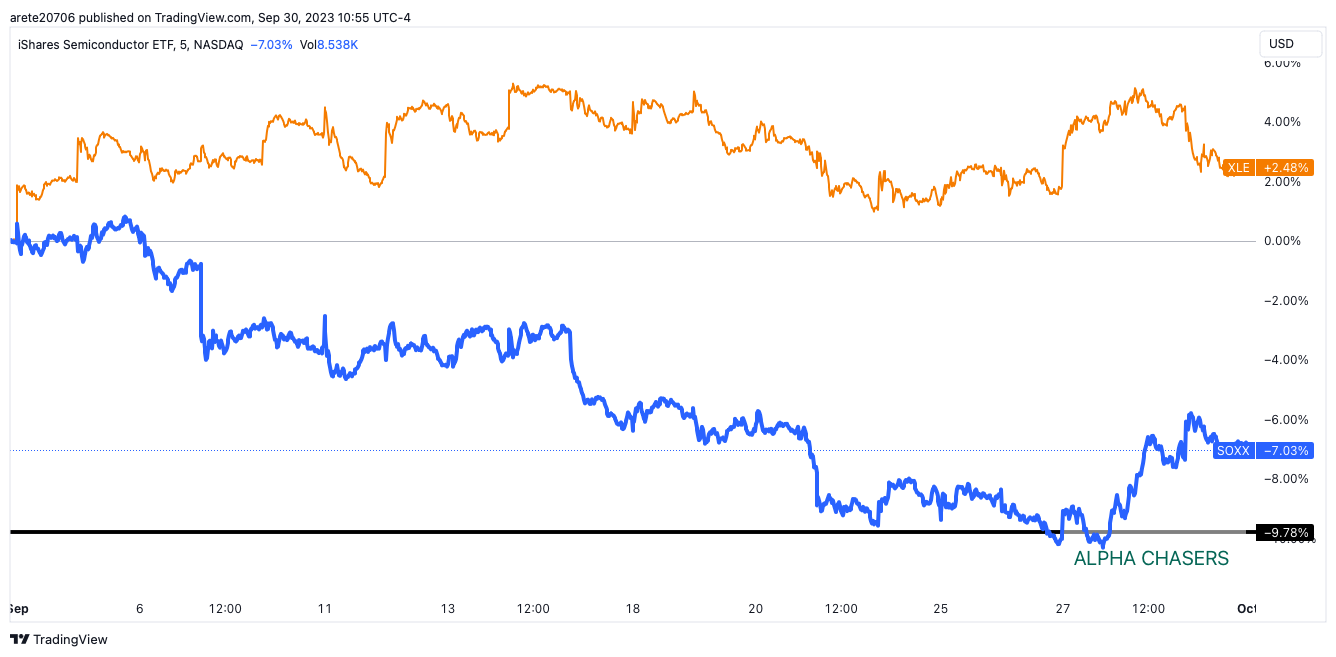
The week was filled with massive uncertainty from Japan possibly raising rates to a U.S. government shut down. By the end of the week we saw sellers of equities becoming exhausted and buyers picking up stocks they considered cheap. Most interesting were the shifts in sector sentiment. Investment banking research houses were discussing the possible slow down in technology spending while stating to expect $100 a barrel oil in the foreseeable future. Energy stocks have been outperforming semiconductors all month. This week was different! .Let’s get to the charts!
SP500($SPY)
Nasdaq($QQQ)
Russell 2000 ($IWM)
Semiconductor Sector($SOXX)
Energy Sector ($XLE)
Energy relative to Semiconductors for the month of September
Energy relative to Semiconductors for the last week.
Apple Stock($AAPL)
Google Stock ($GOOG)
Nvidia Stock ($NVDA)
Tesla Stock ($TSLA)
Nextera Energy ($NEE)
U.S. Dollar ($DXY)
10 year Treasury ($TNX)
Arch Resources($ARCH)
SP500 companies are now borrowing at the highest rate in 15 years
Private Equity fund raising is at the lowest level in over 10 years.
Government shutdown what happens to the SP500 prior to and after the first 10 days.
Venture capital backed public tech companies have negative year over year growth for the first time in decades.
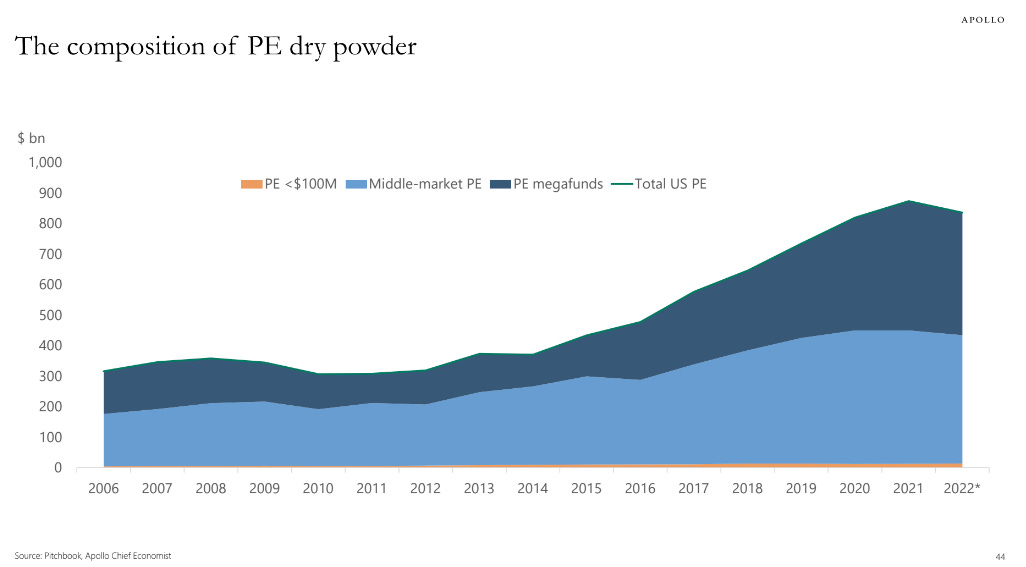
Private equity companies have more dry powder(capital) to do deals then any time in history
Watch this video for a deeper understanding of the Major shift that took place this week and how to benefit from it.
Wishing Everyone Massive Success!


