


📈What Happened In Stocks in 20 Charts

The Nasdaq continues its 7 week streak of closing green and the SP500 extends its streak to 4 weeks. Not to be outdone the Russell 2000 closed over the weekly 200 SMA on the highest volume in 17 months. This was fueled by massive inflows into small and mid tier semi names as well as regional banks. It is becoming clearer to investors that while we may lose another regional bank the system itself is strong. We tend to see shorter time cycles now and much more volatility during that time. When the regional issues started many investors thought we were going to see the 2009 banking crisis revisited. That is not the case. Rotation has been the name of the game and is exactly what is needed to sustain a bull market. Whether that rotation is based upon market cap, sector or asset class does not make a difference. What matters is that the inflows of new capital continue to come into the markets and with inflation no longer at the forefront that is exactly what is happening.
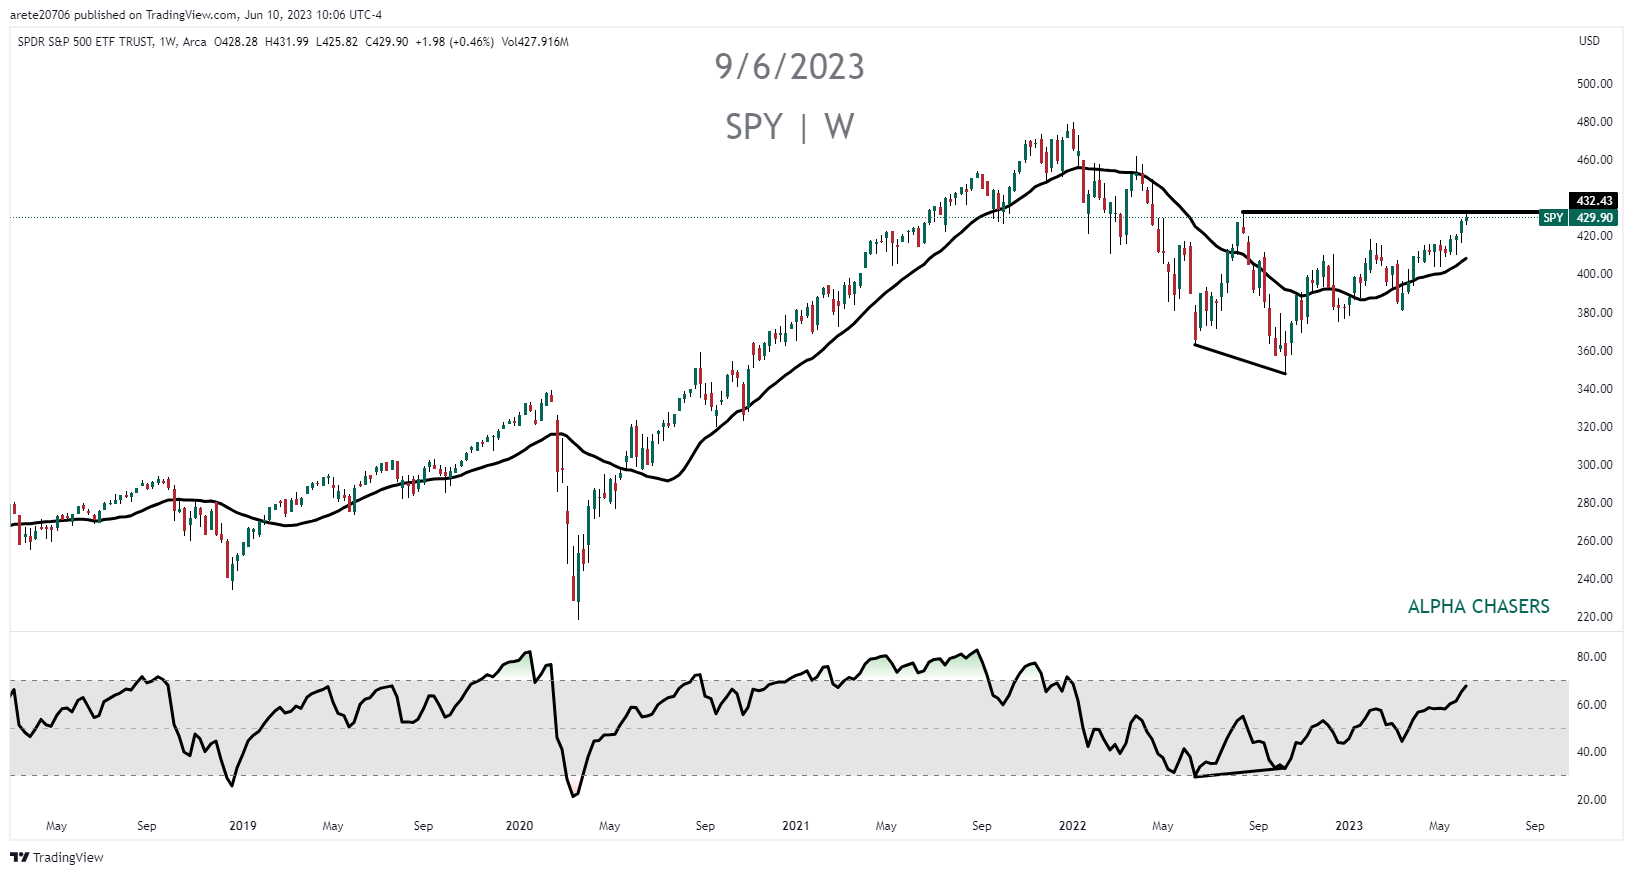
SP500 ($SPY) with another higher high close and right against April 2022 resistance
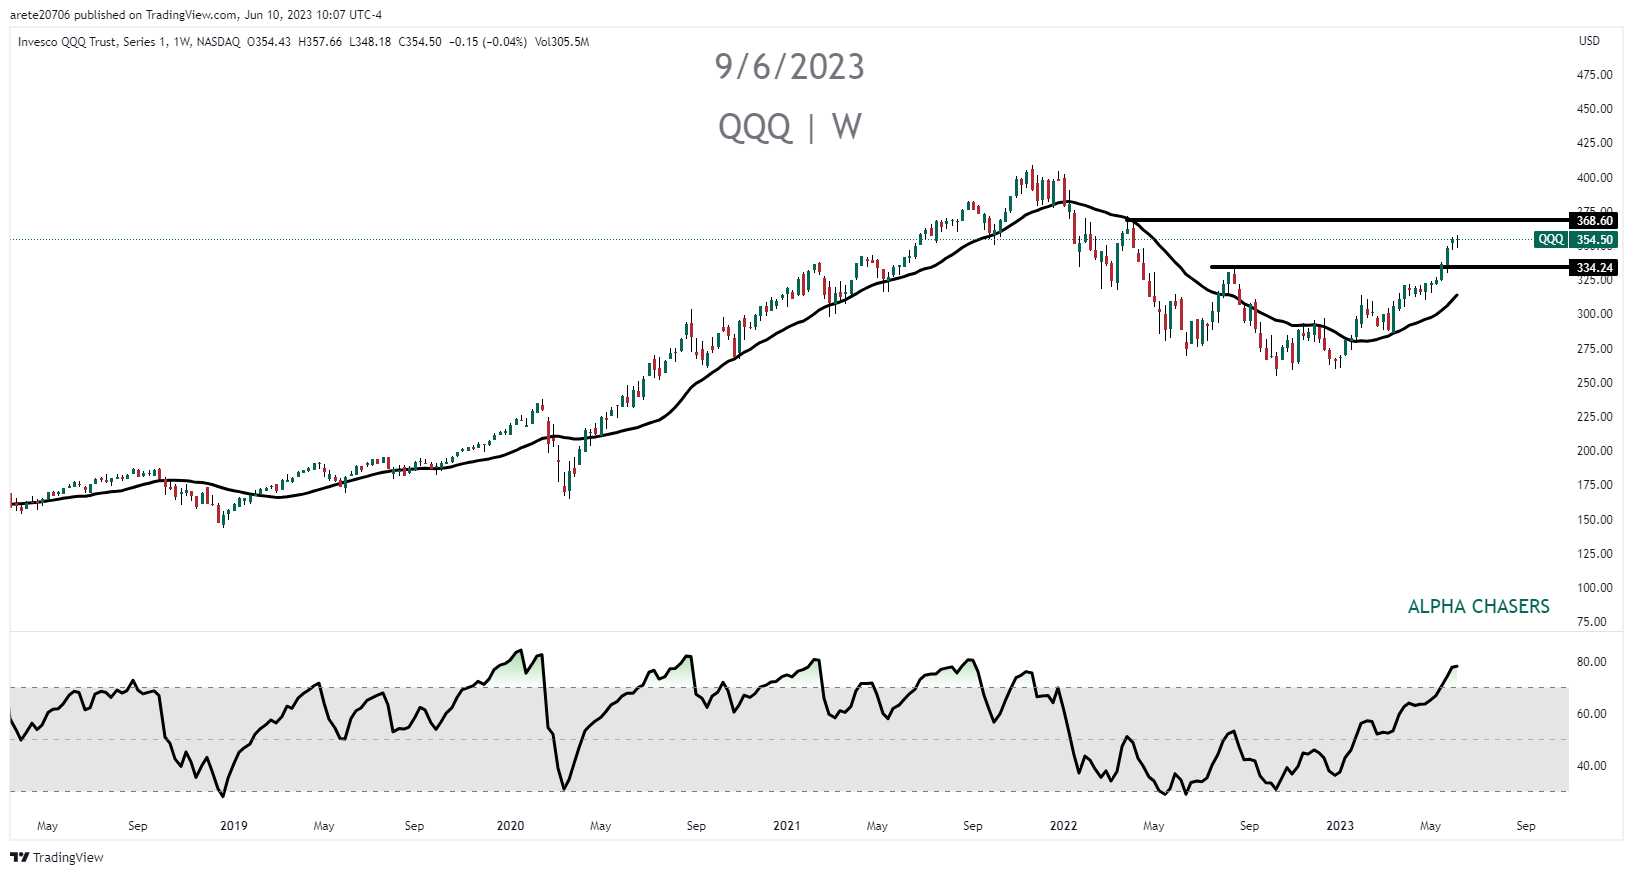
Nasdaq ($QQQ) has major support at $334 now and is approaching overbought according to RSI. Indexes has stay overbought for months.
Russell 2000 ($IWM) finally clearer the 200 weekly SMA and did it on huge volume. $170 support

Semiconductor ($SOXX) sector is building a flag right under the $500 resistance. Note how we hardly retested the breakout.

Regional Banks ($KRE) held the pandemic lows and are trying to push through the neckline. We did flip back over 30 RSI which is bullish.

Energy ($XLE) is attempting to hold a decade lone support level but with the negative RSI this may prover difficult.

Inflation surprises have been to the upside since mid 2020. Three years later we are seeing signs of inflation surprises to the downside. (Graph by JPM)

SP500 stocks above the 200 SMA are currently above 50% for the first time in 5 weeks. This is usually bullish for equities.

NYSE weekly chart with McLellan summation index crossing and making higher highs is usually a bullish sign for equities in the medium term.

Jobless claims continue to tick up showing that rate hikes are slowing job growth.

Apple ($AAPL) making an all time high and new all time weekly closing high.

Netflix ($NFLX) estimated to add 9 million new subscribers by ending password sharing and closing above the weekly 200 SMA for the first time in 18 months.

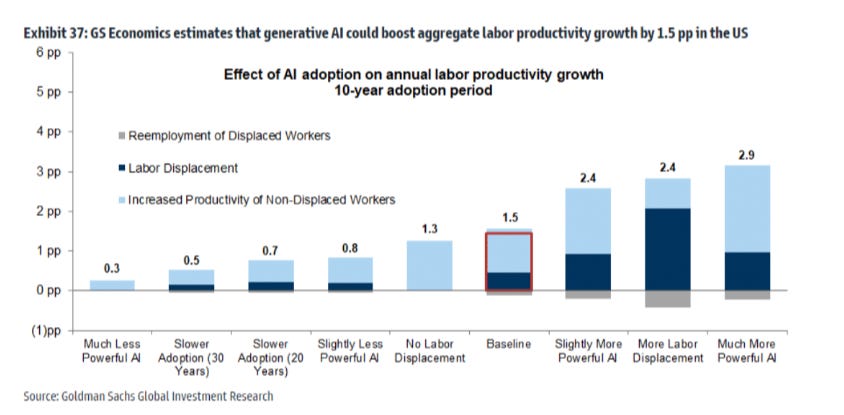
According to GS AI can boost productivity growth by .3 to 2.9% over 10 years depending on its ability to live up to the hype. Side note: It is estimated that certain developers are now 7-8X more efficient after 6 months of using AI.
Tesla ($TSLA) with a clear break above the 200 week SMA and the RSI signaling more room to run. 4 weeks of higher highs.

NVIDIA ($NVDA) continues to build a base after exponential earnings growth release.

Target ($TGT) earnings have been off for a while now and technically losing its footing. A lot of rumors floating around about receivable issues. Very bearish action.

KLA corporation ($KLAC) supplies equipment to NVDA and is currently building a flag above support.

AEHR ($AEHR) Test systems breaking out and closing at all time highs. They supply NVDA as well.

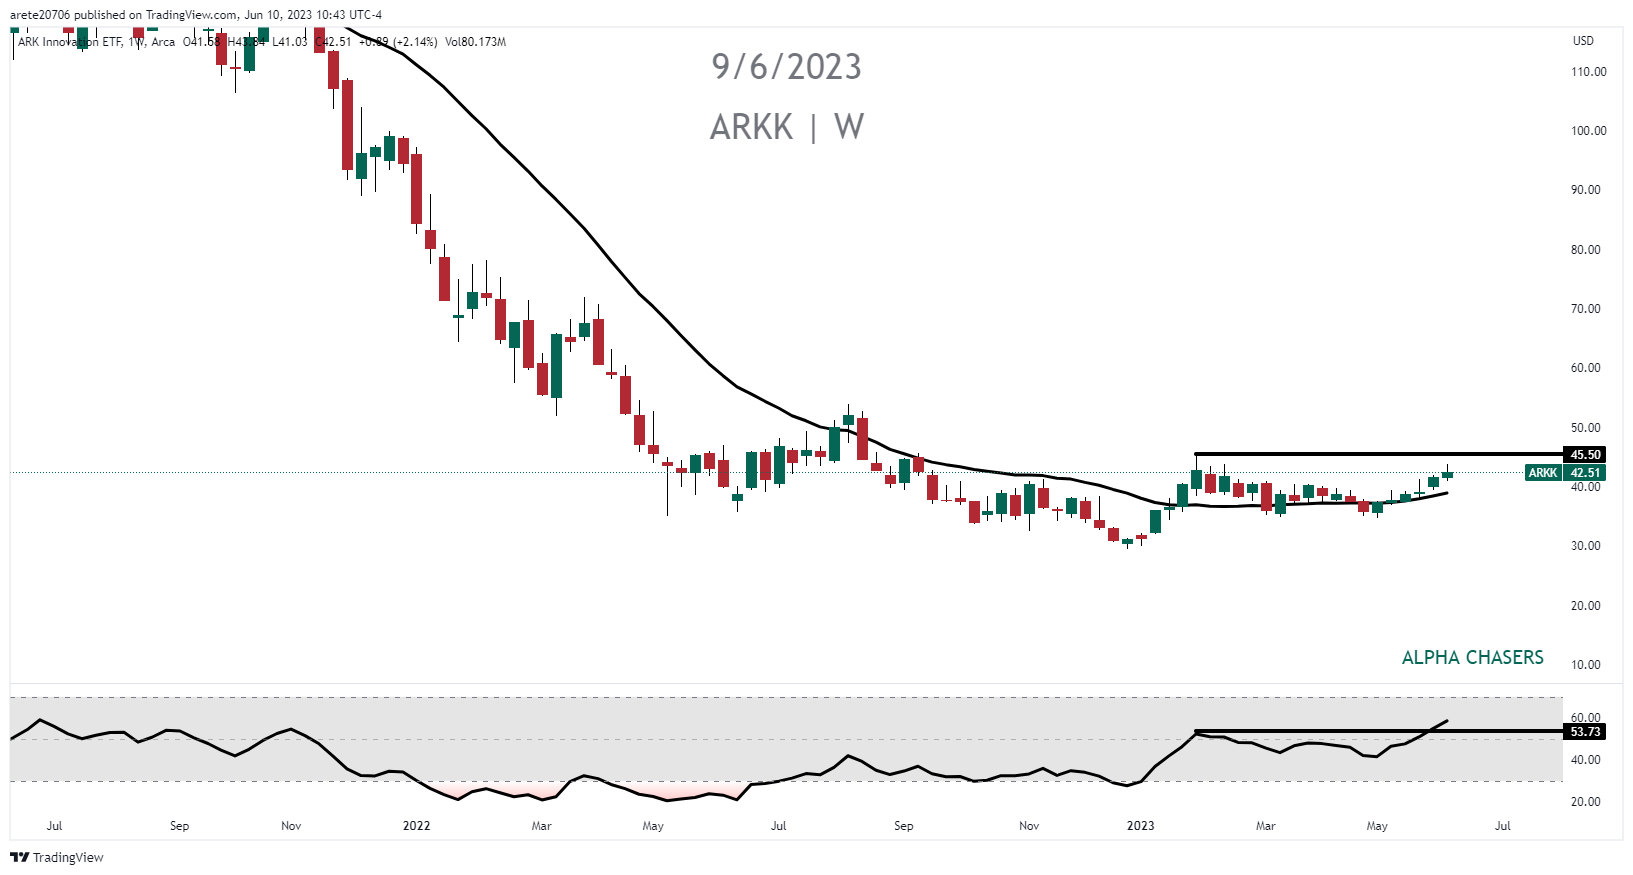
ARKK continues to base and the RSI is forming a positive divergence indicating higher prices.
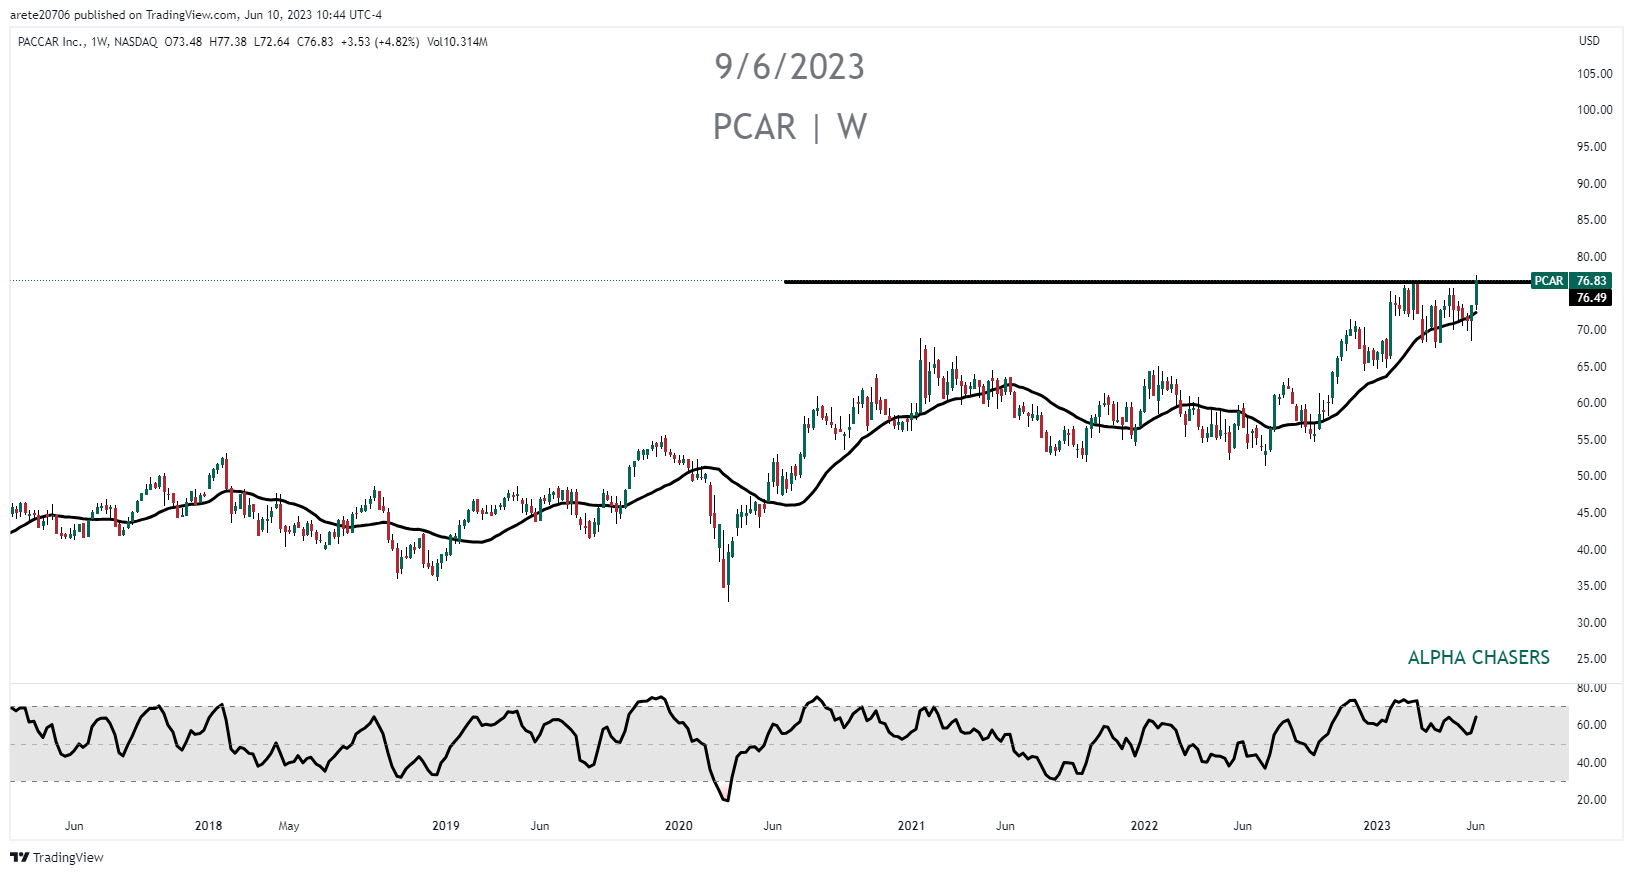
PACCAR ($PCAR) quietly making all time highs. They design and manufacture large commercial trucks through its subsidiaries DAF, Kenworth and Peterbilt.
Watch this video to understand the comparison between now and the Dot Com bull market. Pay attention to the 5 AI stocks that Goldman Sacs has as buy but are not mainstream ideas.
Wishing Everyone Massive Success!