📈What Happened In Stocks in 20 Charts
The Stock market rallied significantly having one of its best weeks of 2023. We saw massive sector rotation and major inflows into the bond market as the peak in Treasury yields appears to be in. This was driven by three major factors:
Jerome Powell dovish speech and the shift to issue more short term debt
Recent economic data confirming the cooling of the economy
Japan’s possible Yen intervention.
Let’s Look at the charts !
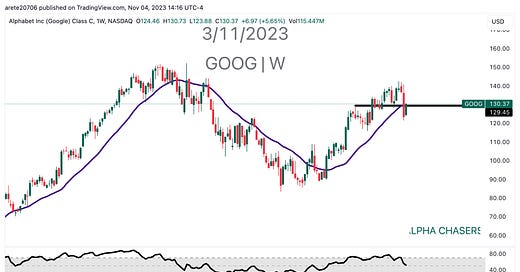
Google ($GOOG) closed right on the 22 SMA weekly.
Tesla ($TSLA) made a lower weekly move and was unable to rally with the rest of the market
S&P 500 ($SPY) experienced a massive inflow into interest rate sensitive sectors
Nasdaq 100 ($QQQ) closed right above the 22 SMA weekly.
Russell 2000 ($IWM) held its major bottom and benefits the most from lower rates.
Semiconductors ETF ($SOXX) held major support of $444
Financials ETF ($XLF) closed right under the 22 SMA weekly
US Dollar Index ($DXY)experienced its worst loss in 14 weeks.
Nvidia ($NVDA) held major support of $402 and closed above 22 SMA weekly.
Dow Jones Industrial Average ($DIA) is currently only 7.2% away from all time highs.
Crude Oil Futures (CL1!) continues to tumble despite conflict in the middle east. Must hold 22 SMA weekly.
Netflix ($NFLX) breaking out of a massive downward trend line(DTL)
Regional Banking ETF ($KRE) held the pandemic bottom as multiyear support.
Apple ($AAPL) bouncing on weak holiday guidance.
Bad news + higher prices = bullish sentiment
Microsoft ($MSFT) closing at all time highs on the weekly chart.
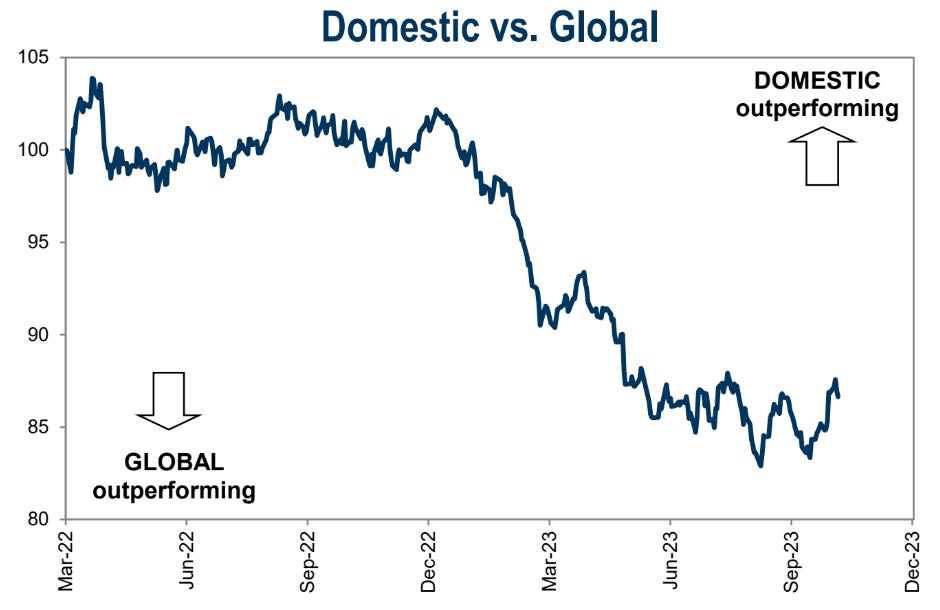
Domestic vs. Global performance appears to have bottomed.
Sector and stock correlation is seeing an uptick which makes top down trading more favorable.
Chart of the week - nonprofitable tech. Day return is ~13.5% and ranks in the 99.6% percentile of 2 - day returns in the last 5 year per Goldman Sacs
Income needed to be in the top 1% by US State
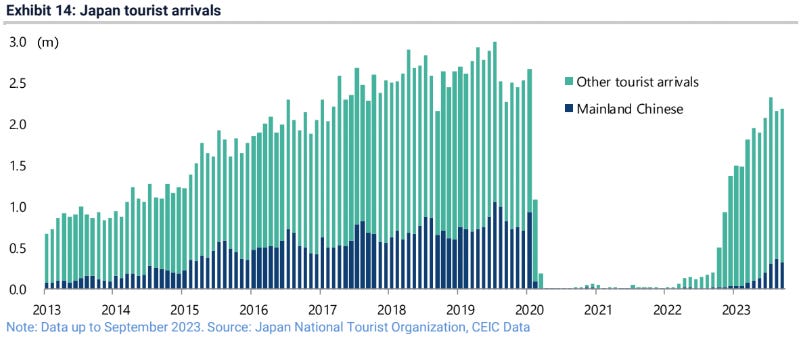
Japan tourist arrivals are still below pre pandemic levels
Watch this video for a detailed look into what sectors are set to explode with the shift in yields.


