📈What Happened In Stocks in 20 Charts
The SP500 broke a critical level last week leading to significant weakness across the board. The 10 year treasury is approaching 5% which is leading to more investors buying bonds and selling equities. The recent escalation in the Israel Palestine war is leading to oil prices rise. This is causing consumers to become concerned about inflation. Overall the landscape has changed drastically in the past two weeks. Let’s look at the charts.
Google ($GOOG) holding above major support and the 22 SMA weekly.
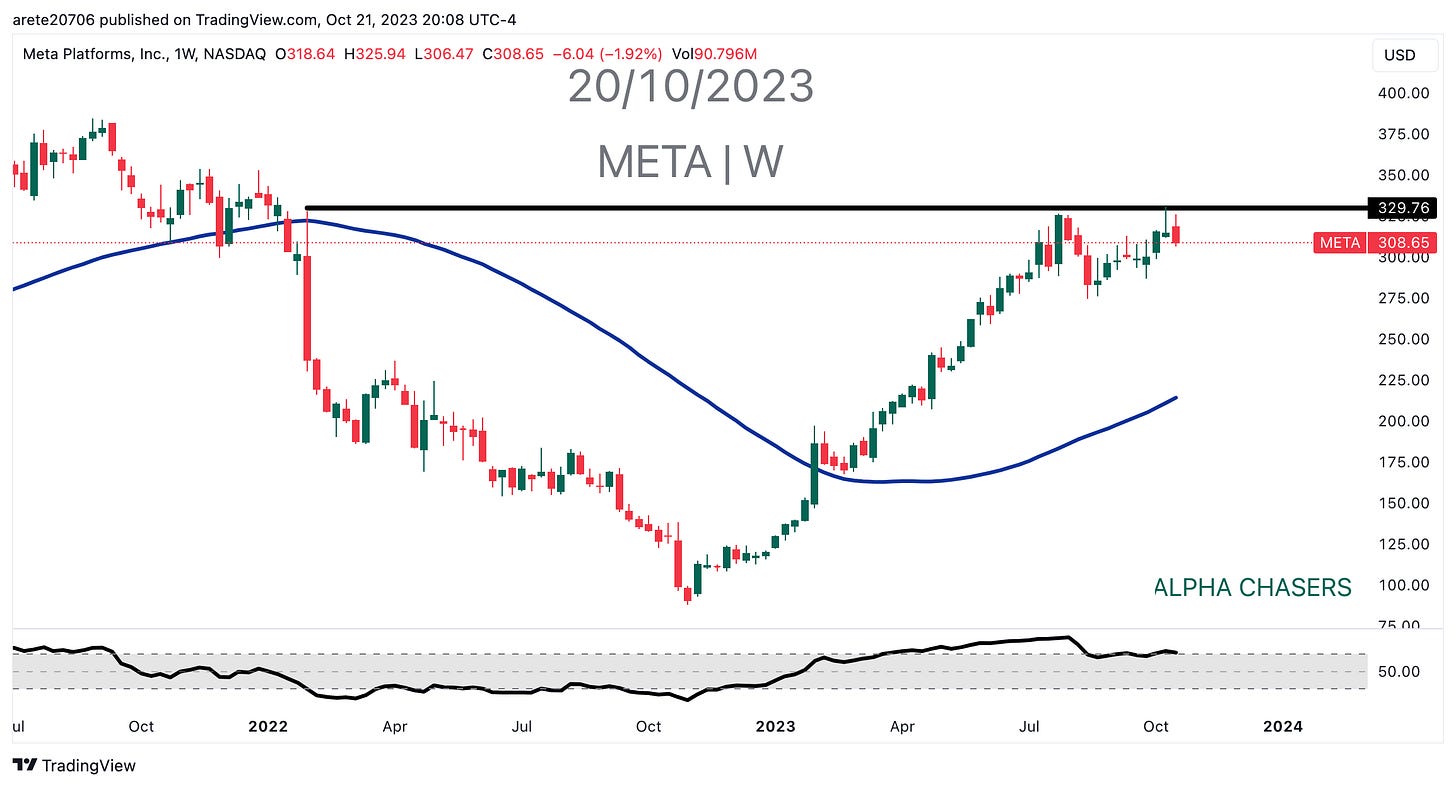
Meta Platforms ($META) rejecting $330 major resistance
Tesla ($TSLA) sitting a on critical area at $212 after massively disappointing earnings quarter.
S&P 500 ($SPY) breaking a bear pendant.
Nasdaq ($QQQ) with a clear rejection and lower lows
Russell 2000 ($IWM) sitting on major multiyear support.
Semiconductors ETF ($SOXX) exhibiting the same pattern that markets the 2021 top
Financials ETF ($XLF) breaking down and DTL continuing to act as major resistance.
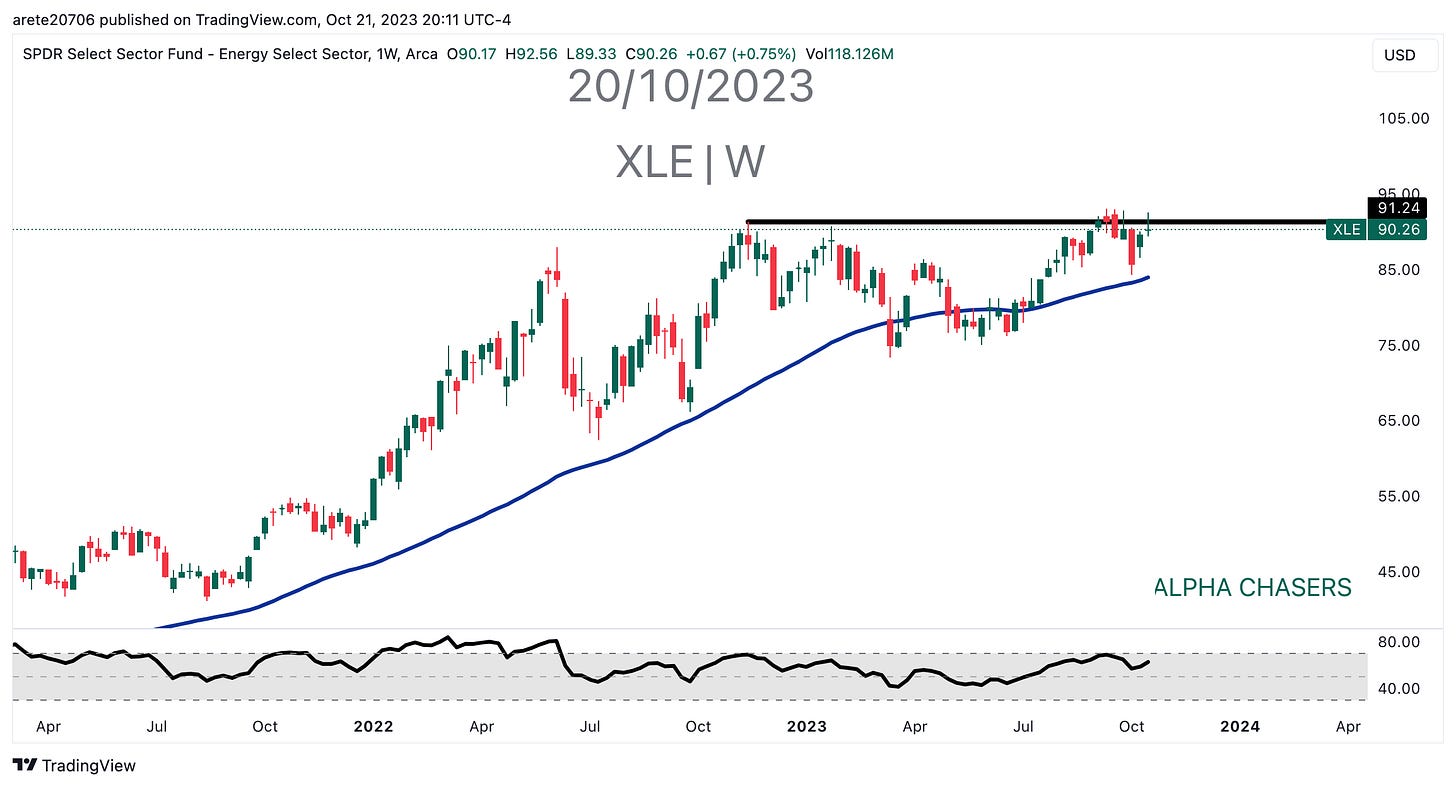
Energy ETF ($XLE) continues to push higher testing resistance.
US Dollar Index ($DXY) looks to be holding after 11 straight higher high closes.
10-Year Treasury Yield ($TNX) tested 5% recently putting upward pressure on mortgages and loans.
2-Year Treasury Yield ($US02Y) is leveling off at 5% range .
2-Year / 10-Year Treasury Yield spreads is flattening and starting to roll over.
Gold Trust ($GLD) continues to see inflows and is pushing against major resistance.
Barrick Gold Corporation ($GOLD) making another attempt over 22 SMA weekly and RSI over 50
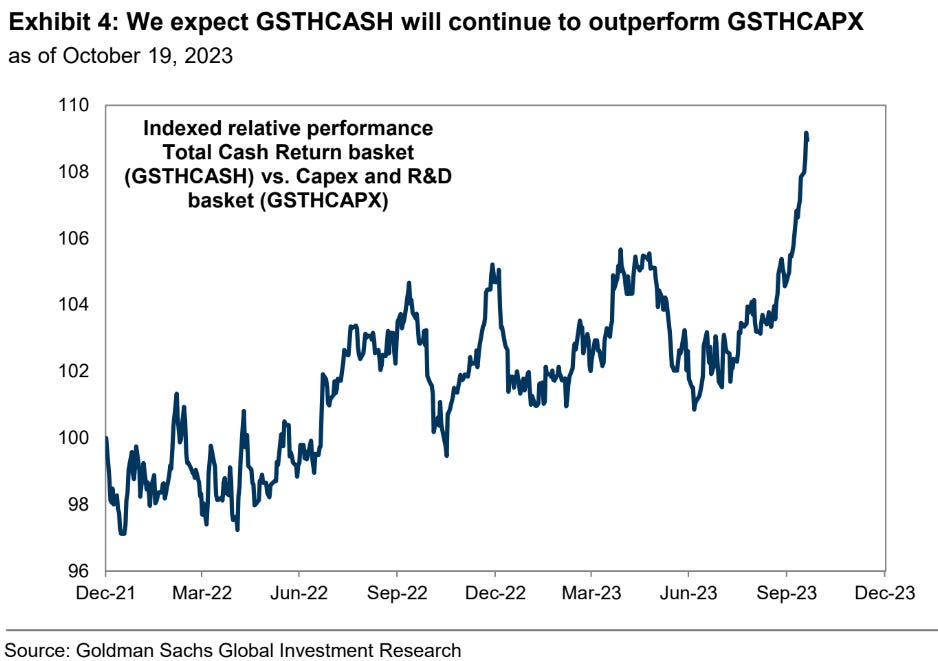
Goldman Sacs expects companies paying out cash(dividends) will continue to outperform companies investing in research.
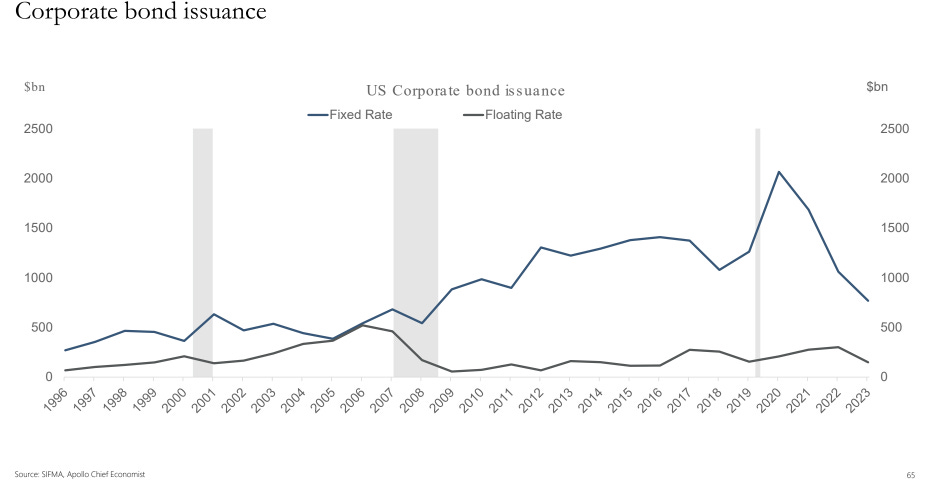
Corporate Bond Issuance at a fixed rate is at 2007 levels.
Divergence Between US and Europe Lower Rated Junk Bond Spreads are at the biggest divergence in decades
IG Market is Eight Times Bigger than HY and Eight Times Bigger than the Loan Market. This is the widest gap on record.
Debt-to-Equity Ratio is Very Low for Corporate America. We are at the lowest levels in over 20 years.
Watch this video for specific levels to watch on the SP500 and to see what Smart Money is doing.
Wishing Everyone Massive Success!


