📈What Happened In Stocks in 20 Charts
Indexes sold off after a solid rally due to profit taking and uncertainty. It became clear on Friday that there was tension in Russia and that there may be a conflict. The conflict continues to grow and the market does not like uncertainty. In time such as these we see investors raise capital and buy defensive names. Energy , Basic material and utilities do well in crisis. Let’s take a look at what happened.
SP500 ($SPY) holds key support level and continues to build momentum.
Nasdaq ($QQQ) rejects the $371 level. It might need a rest and to eat up supply at these levels.
Russell 2000 ($IWM) is wedged in between a multiyear channel.
Semiconductor Sector ($SOXX) with a clear rejection of $501 and closing at the low of the week.
Energy Sector ($XLE) needs to hold the low of the h pattern. Russian conflict should lift oil prices.
Tesla ($TSLA) continues to act great and stays above $254.50 key level.
AAPLE ($AAPL) making all time highs. This is usually not sign of a bear market or correction.
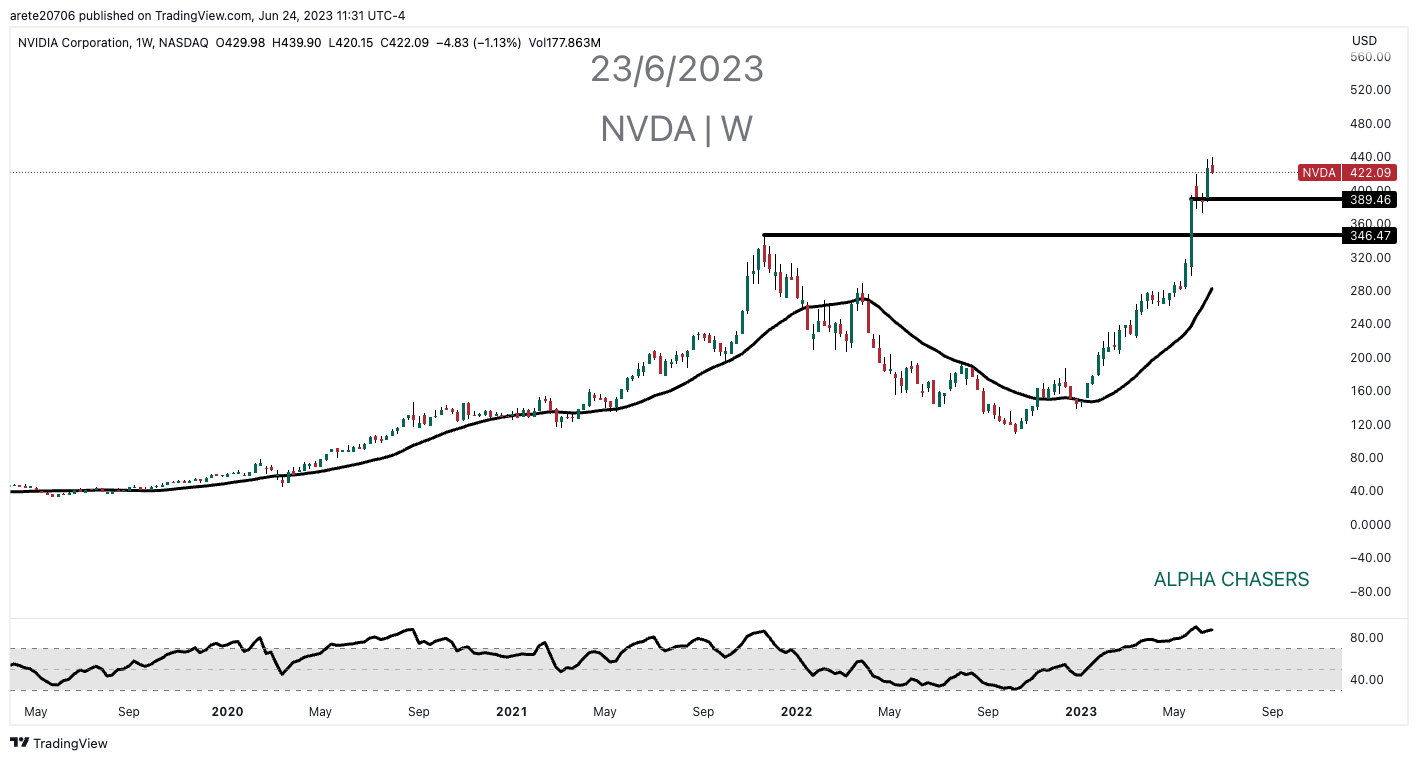
NVIDIA ($NVDA) continues to digest a massive move with minor and major support marked on the chart.
Advanced MICRO DEVICES ($AMD) sold off massively after their AI event day. A break here could test $99
MONGO DB INC ($MDB) recent partnerships have lead to renewed interest in the stock. We are building a massive high tight flag.
Volatility ($VIX) is down to pre-pandemic levels
Wheat ($WEAT) rallying ahead of the Russian conflict and clearing the 22 week moving average for the first time in a year.
Broadcom ($AVGO) needs to hold $812 but for now still building a huge flag.
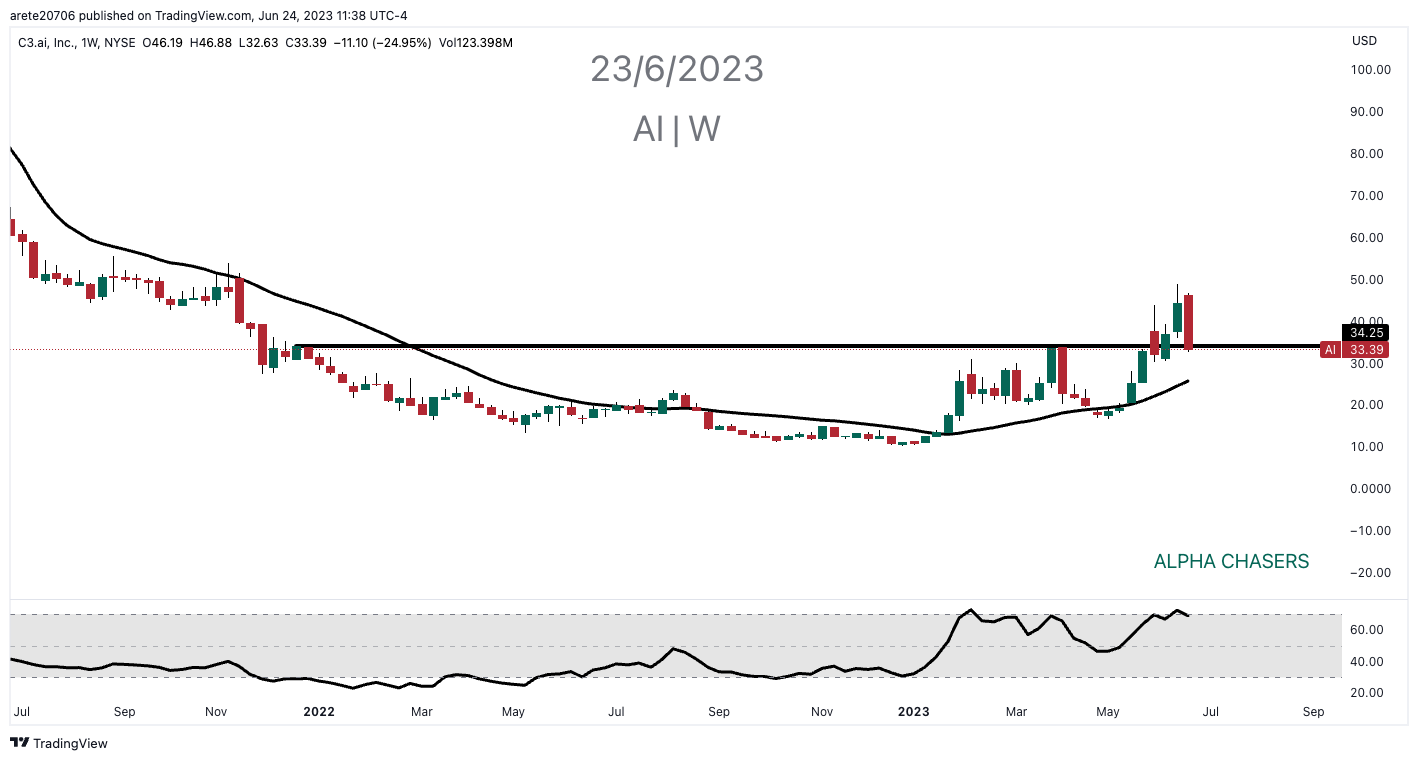
C3.AI ($AI) is sitting below major support
Amazon ($AMZN) continues its ascent with another up week. $124.75 support
Net exposure of cyclicals is at historically low levels. The chart below shows us at a level of defensive buying last seen during the pandemic.
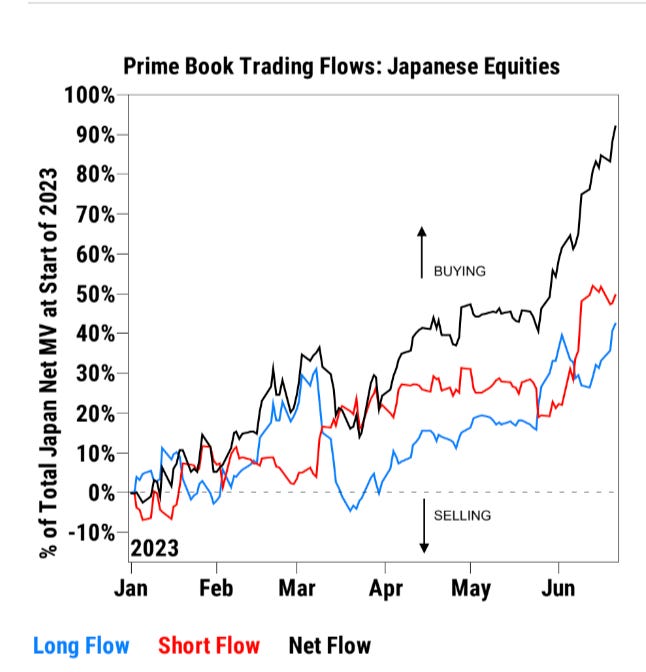
Net inflows into Japanese Equities continues to make new highs. ($EWJ)
There is a massive divergence globally in demand. Manufacturing remains down in a contraction phase (under 50) while Services continues to expand. This shows a shift is how money is being allocated.
Since 2009 Office properties have inflated in value more than any other sector of real estate.
PMI predicts GDP we can see from the peaks and valleys. The last divergence this great was 2020 and before that 2009.
Watch this video for an extensive overview of what to expect next week. It is heavily detailed with exact key levels.
Wishing Everyone Massive Success!


