📈What Happened In Stocks in 20 Charts
We had a huge week of economic data.Consumer prices (CPI) rose 3.2% in July, the first increase in 13 months. The annual headline rate's increase was largely due to comparisons to July 2022, when monthly inflation turned negative. Prices rose 0.2% on a monthly basis, driven by shelter costs, which accounted for 90% of the increase, according to the BLS report.
The Producer Price Index (PPI), which tracks the average change in prices that businesses pay to suppliers, rose 0.8% annually in July. This is above June's upwardly revised increase of 0.2% and higher than expectations for a 0.7% gain, according to consensus estimates. Producer price hikes increased 0.3% from June to July, the highest monthly increase since January. PPI is a closely watched inflation gauge since it captures average price shifts before they reach consumers. Most troubling is that the PPI's energy index, which increased 0.7% in June, showed that prices were flat for July. The fact that energy prices were not a contributor to this month's reading makes this number jarring. It is a reminder that the Federal Reserve's fight against inflation is going to remain hawkish in the near term. Let’s get to our charts!
SP500 ($SPY) rejected the 458 level and broke the 5 SMA weekly for the first time since March. RSI is rolling
NASDAQ($QQQ) $390 resistance and broke the 5 SMA weekly
RUSSELL 2000 ($IWM) continues to remain in a multi year base
TEN YEAR TREASURY ($TNX) setting up to challenge 15 year highs yet again
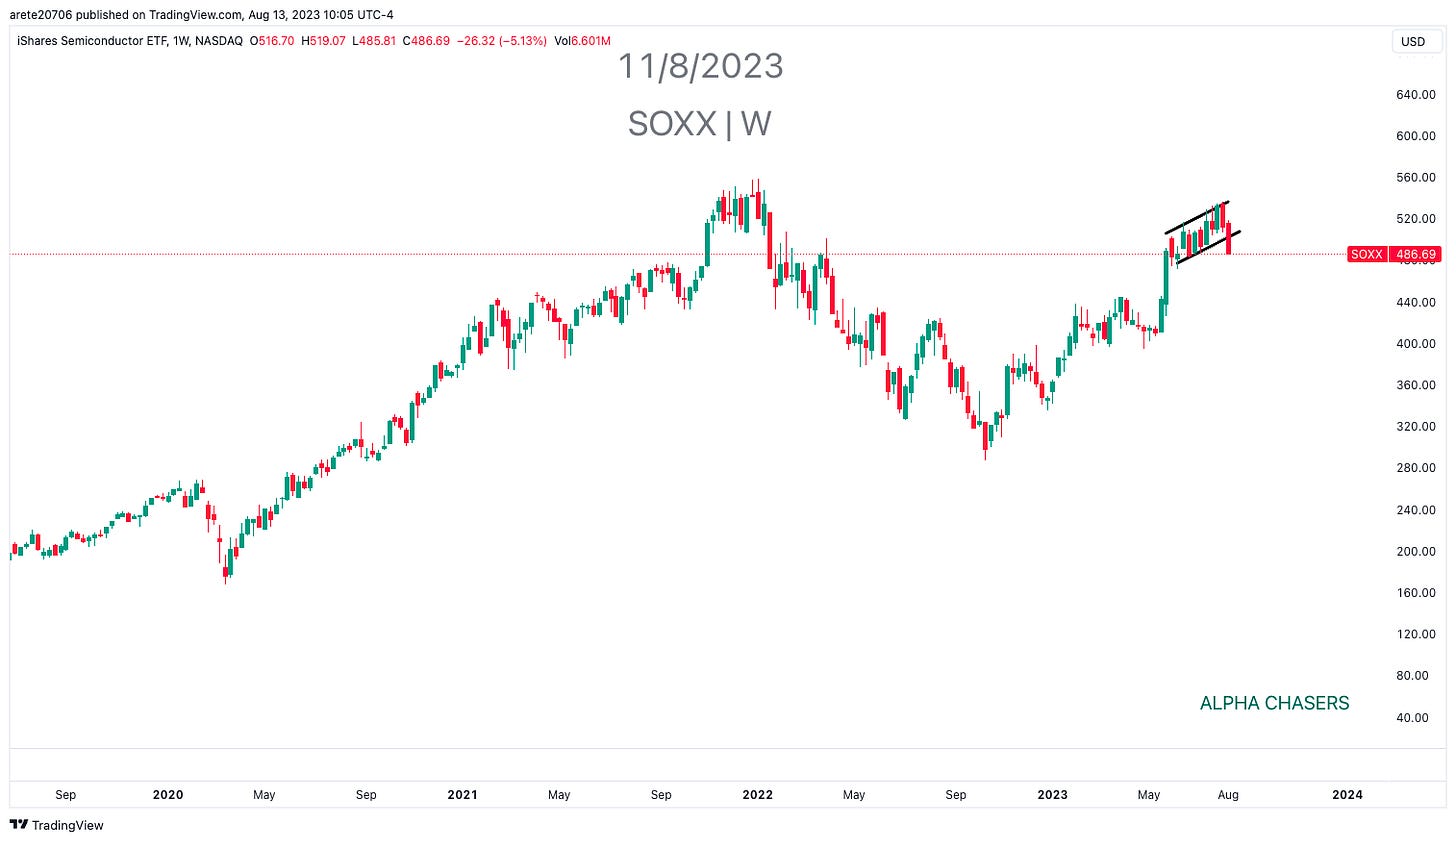
SEMICONDUCTOR SECTOR ($SOXX) clear rejection of 500 level and broke down out of the bull flag.
ENERGY SECTOR ($XLE) breaking DTL and MACD crossing zero line.
TREASURY INFLATION BONDS ($TIPS) continue to trade near lows
ENERGY RELATIVE TO THE SP500 ($XLE/$SPY) forming a bottom and broke the DTL
PERCENTAGE OF SP500 STOCKS ABOVE THEIR 50 DAY MOVING AVERAGE dropped from 90 which is usually a froth level to 54 in two weeks.
APPLE STOCK ($AAPL) is sitting right on the 22 SMA weekly and major support
MICROSOFT STOCK ($MSFT) forming a double top after a blow off move. Still above the 22 SMA weekly for now.
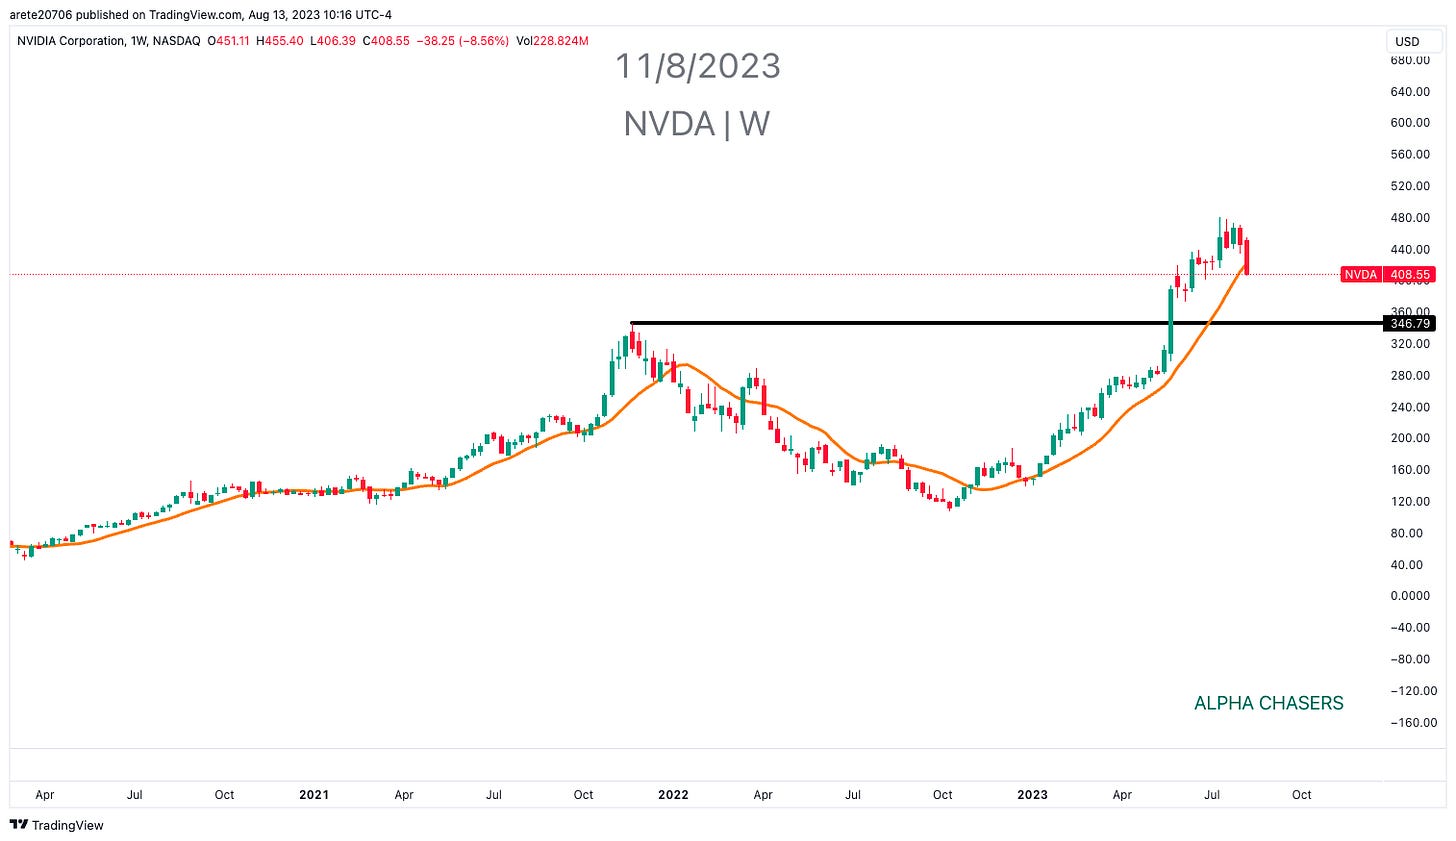
NVIDIA STOCK ($NVDA) first close under 12 SMA weekly in all of 2023. $346 major support
SUPER MICRO COMPUTERS STOCK ($SMCI) being destroyed despite good earnings. First close under 12 SMA weekly all year. $214 major support
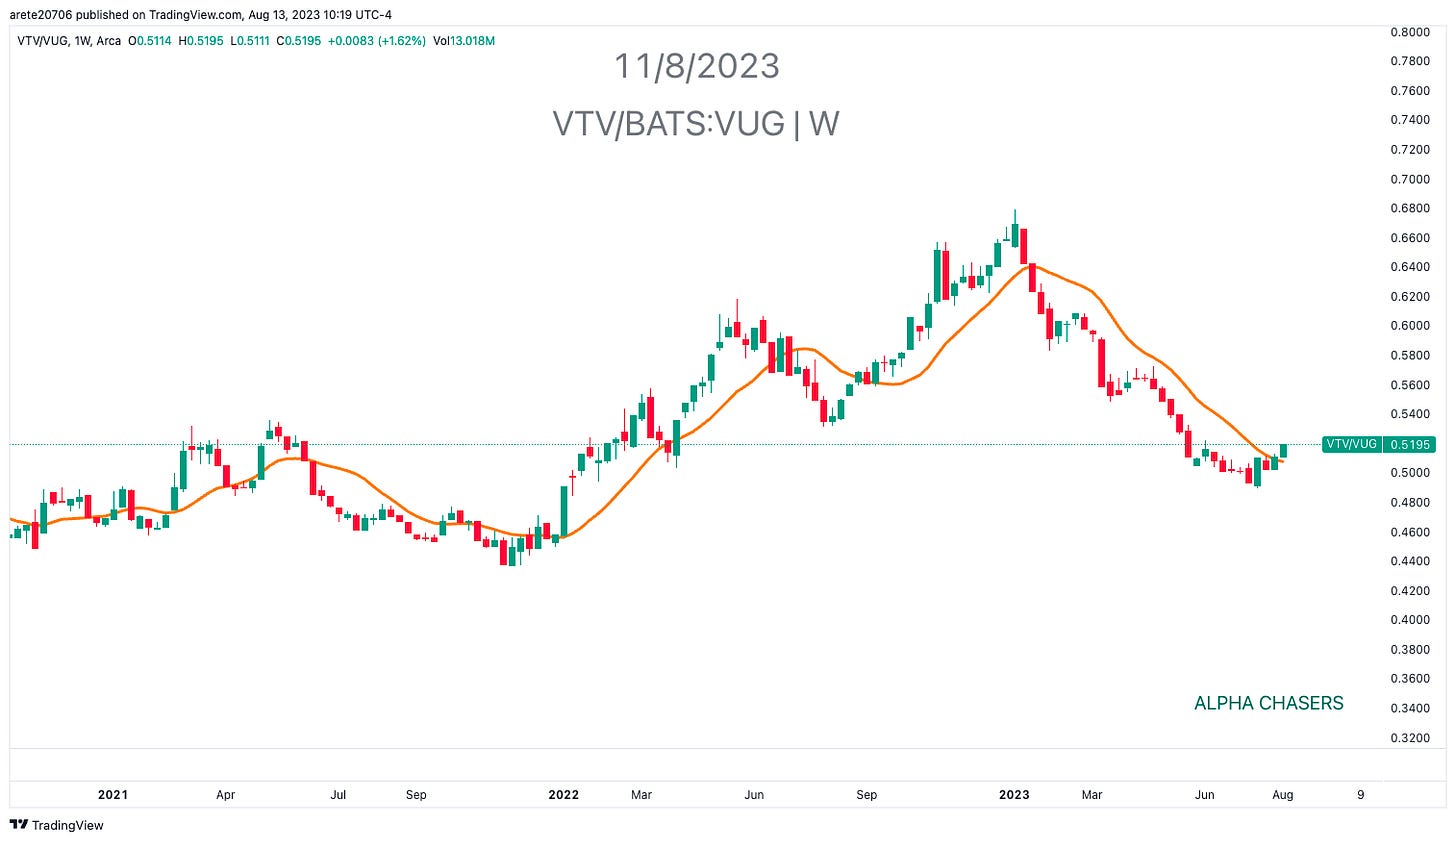
VALUE RELATIVE TO GROWTH ($VTV/$VUG) over 12 week SMA for first time in 2023
NYSE WITH McCLLELAN SUMMATION continues to roll over
CREDIT CARD DELINQUENCIES continue to uptick
MORTGAGE ACTIVITY AND RATES are aligned. As rates rise we are seeing activity fall.
FOOD CONSUMPTION CHANGES IN THOSE TAKING A WEIGHT LOSS DRUG
COMPANIES MOST AT RISK WITH CHANGES IN HEALTHIER CONSUMER HABITS
OVERALL POSITIONING HAS DECLINED NO MATTER THE METHODOLOGY is rolling.
WATCH THIS VIDEO FOR A MORE INDEPTH LOOK AT WHAT IS SETTING UP TO HAPPEN THIS WEEK. PAY CLOSE ATTENTION TO THE NVIDIA ($NVDA) CHART
Wishing Everyone Massive Success!


