📈What Happened in Stocks in 20 Charts
What a difference a week can make. We had significant improvement in the bond market. The middle east conflict is being contained for the moment. Earnings this week were well received. The indexes continued their ascent with Mega tech seeing the most inflows once again. The dollar stabilized and rates have topped out at least in the short term. Let’s get to the charts!
Google ($GOOG) closed back above the 22 SMA on the weekly.
Tesla ($TSLA) contineus to struggles and the MACD is breaking the zero line.
S&P 500 ($SPY) held the zero line on the MACD and back above 22 SMA
Nasdaq ($QQQ) has the MACD curling up and back above the 22 SMA.
Russell 2000 ($IWM) held major support but continues to be the weakest index.
Semiconductors ETF ($SOXX) back above the 22 SMA for the first time in 7 weeks .
Financials ETF ($XLF) are attempting to stabilize. Key word is attempting.
US Dollar Index ($DXY) has continued to rejected $107.
Nvidia ($NVDA) back above the 22 SMA and second highest weekly close on record.
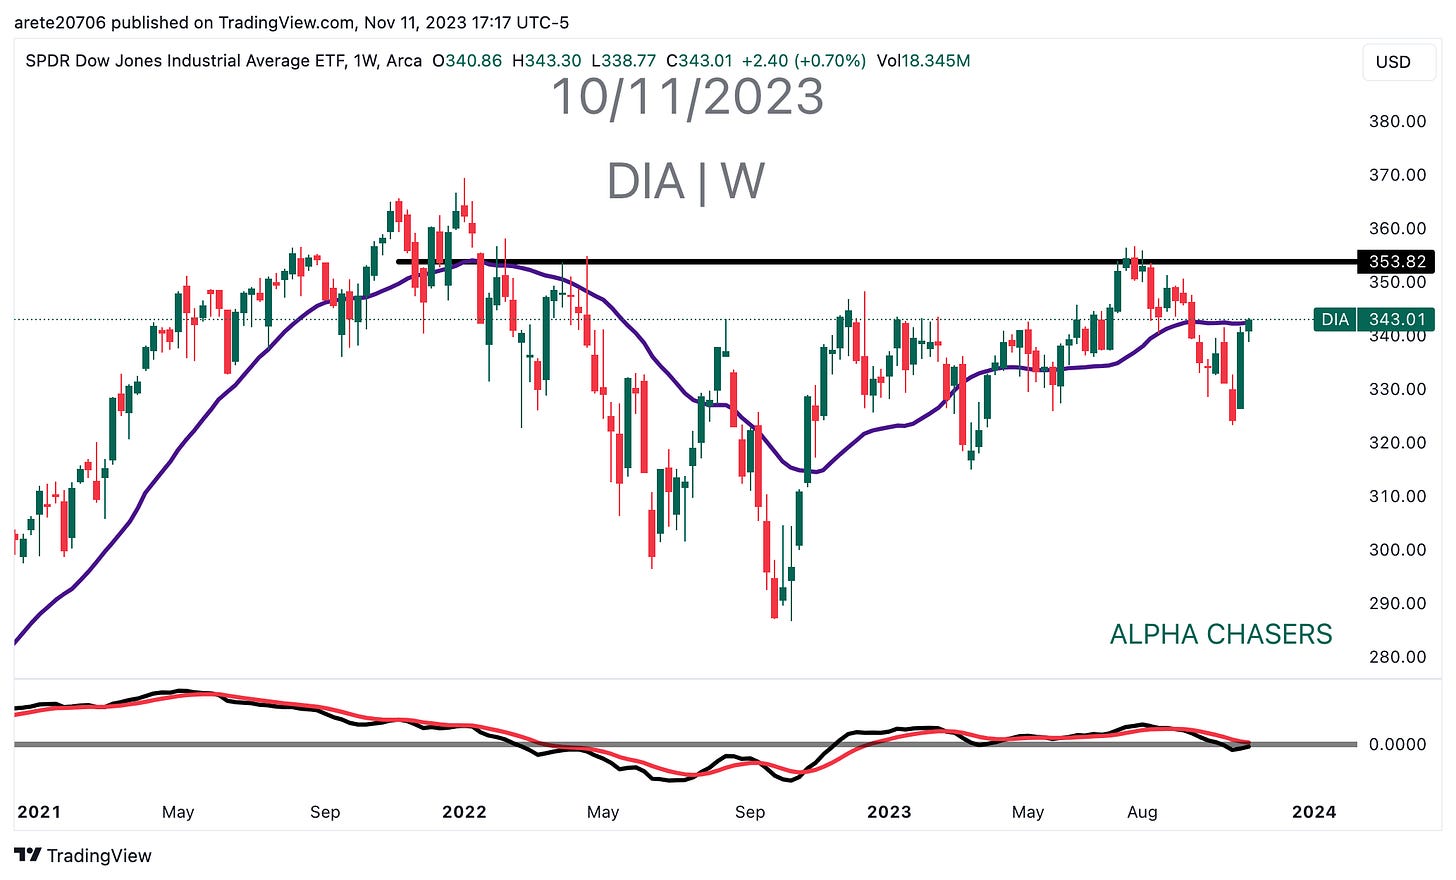
Dow Jones Industrial Average ($DIA) sitting right on the 22 SMA.
Crude Oil Futures (CL1!) rejected the $90s and broke below the 22 SMA. MACD bearish cross.
Netflix ($NFLX) sitting on major resistance.
Apple ($AAPL) breaking above 22 SMA after spending a few weeks below it.
Microsoft ($MSFT) braking out and making all time highs.
Taiwan Semiconductor ($TSM) solid capacity utilization numbers resulting in a close above the 22 SMA for the first time in months.
Nasdaq ($QQQ) compared to Semiconductors ETF ($SOXX) showing underperformance.
S&P 500 ($SPY) compared to Communications ETF ($XLC) and Tech ETF ($XLK)
Bull minus Bear spread for the past 30 years.
Christmas spending per category 2022 to 2023 expectations
Domestic versus Global appearing to have made a bottom.
Growth is pulling away from value
Economic surprises are breaking to the downside
Watch this video to understand where the money is flowing into the end of the year.


