📈What Happened In Stocks in 20 Charts
The federal reserve paused raising interest rates on Wednesday. This was widely expected. What was not expected was that several key fed members stated that rates will stay higher for longer. They also pushed out the prospect of a rate cut to 3rd quarter 2024 which is 6 months longer than expected. This caused the markets to sell down. Overnight people began to read and understand what transpired and selling accelerated into Thursday. Technically, we are at some key levels. Let’s look at the charts.
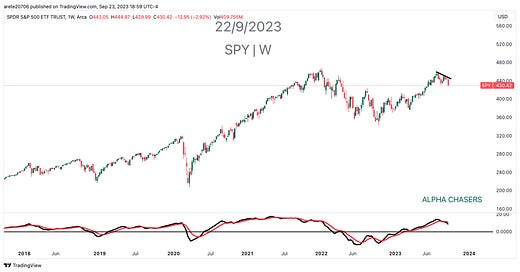
SP500($SPY) made a lower low on the weekly for the first time in 52 weeks. MACD is rolling over
Nasdaq($QQQ) sitting right on the 22 week SMA and MACD is rolling.
Russell 2000 ($IWM) has a multiyear base with $199 resistance.
Semiconductor Sector ($SOXX) has an very similar pattern to the last high with price and MACD
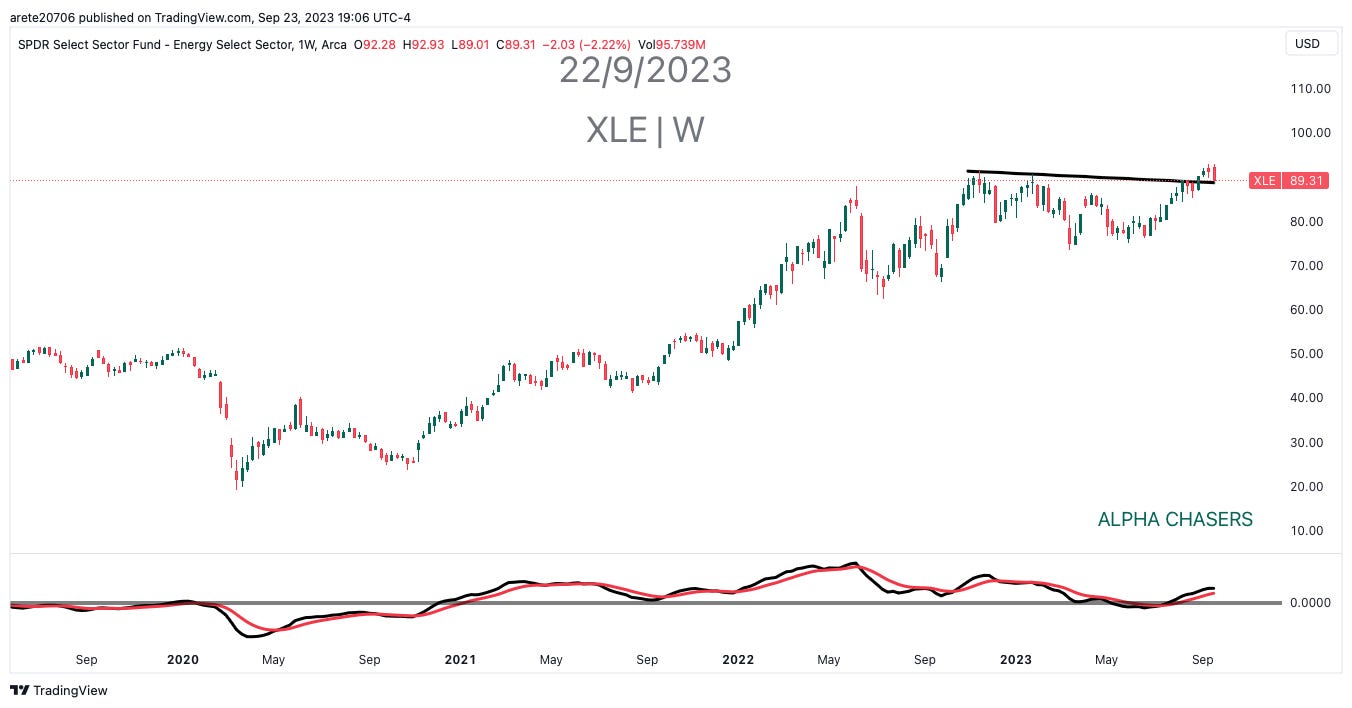
Energy Sector($XLE) MACD is over the zero line and price is still near all time highs.
Consumer discretionary ($XLY) rejected at the $173 level with a very bearish bar this week.
Ten year treasury yield ($TNX) yields are at decade highs.
U.S. Dollar ($DXY) continues to rise after holding multiyear support and breaking out of the falling wedge.
Tesla Stock ($TSLA) is still pinned under the multi year downward trend line.
Apple Stock ($AAPL) continues to test the $173.75 level and MACD rolling over.
Microsoft Stock ($MSFT) MACD rolling and $345 resistance
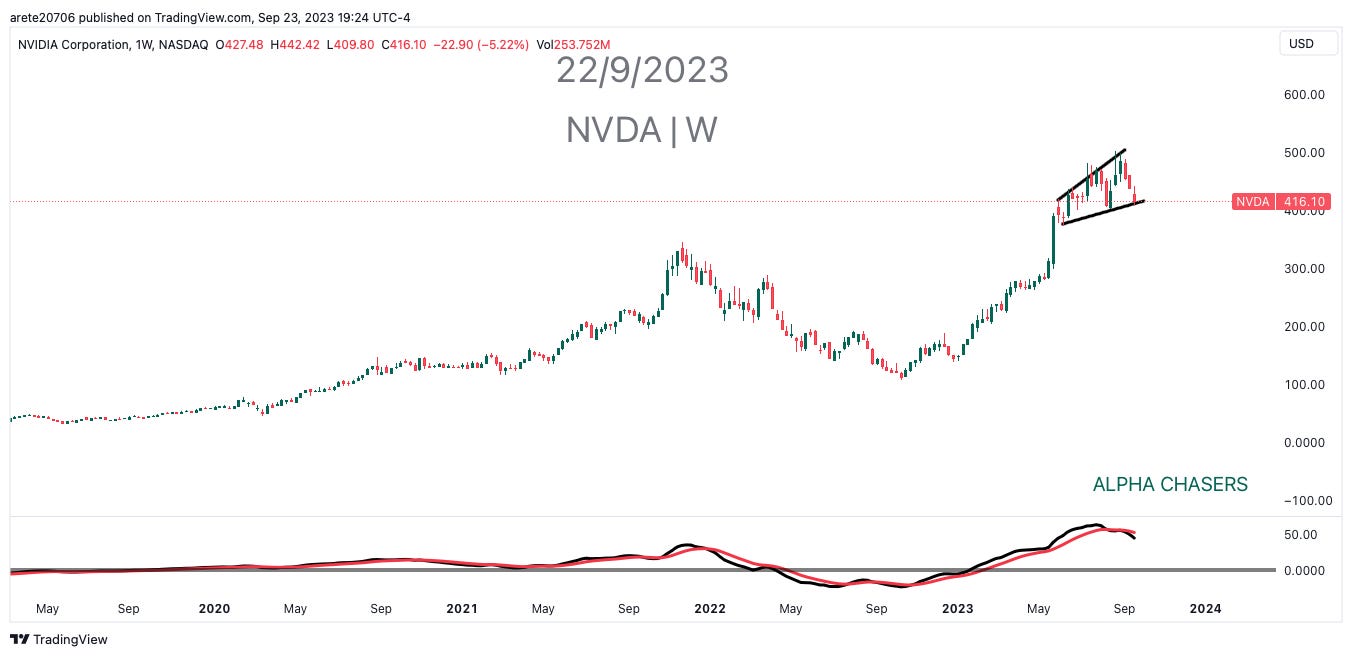
Nvidia Stock ($NVDA) has a megaphone pattern and is sitting on the low end with MACD rolling.
AMZN Stock ($AMZN) rejected $146 and had bearish action all week.
Taiwan Semiconductor ($TSM) is on its 4th week of lower lows and MACD setting to cross the zero line.
Uranium ETF ($URA) has a multiyear breakout and has the beginning of a flag formation.
High free cash flow stocks are starting to outpace Low adjusted FCF.
Energy stocks are starting to pull away from crude oil prices.
Per Goldman Sacs: Funds continue to buy defensive names and sell everything else.
Expected Dot plot shows lower expectations of any more hikes and rates coming down soon. At a minimum we see more agreement on monetary policy.
Actual release of the dot plot shows much more uncertainty as several members expect rates need to stay higher for longer. Compare the green and purple with above.
Watch this video. We are at a major inflection point in the market and in this video I cover exactly what to watch for. Stock coverage is at the end of the video. Pay close attention to what is said about why Tesla was so weak on Friday.
Wishing Everyone Massive Success!


