📈What Happened To Stocks in 20 Charts
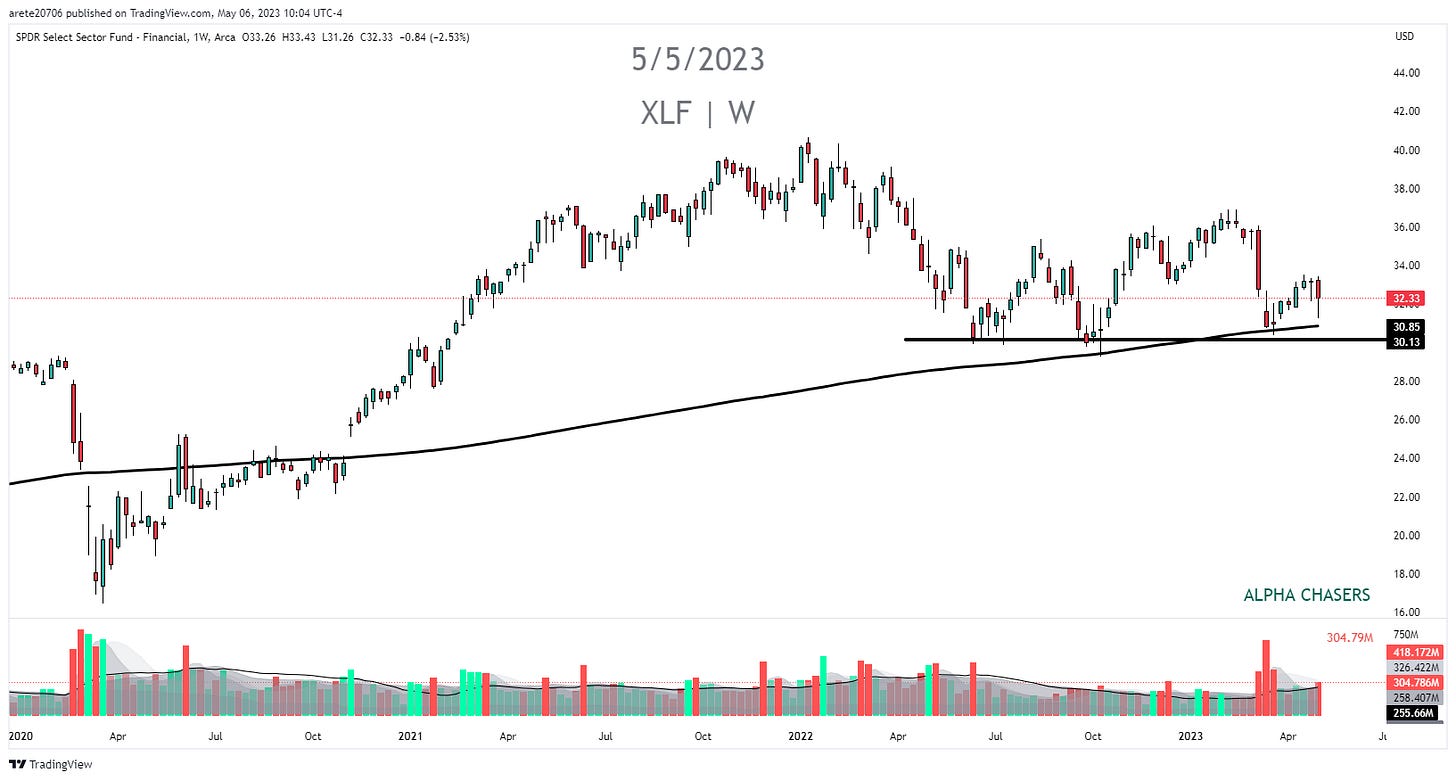
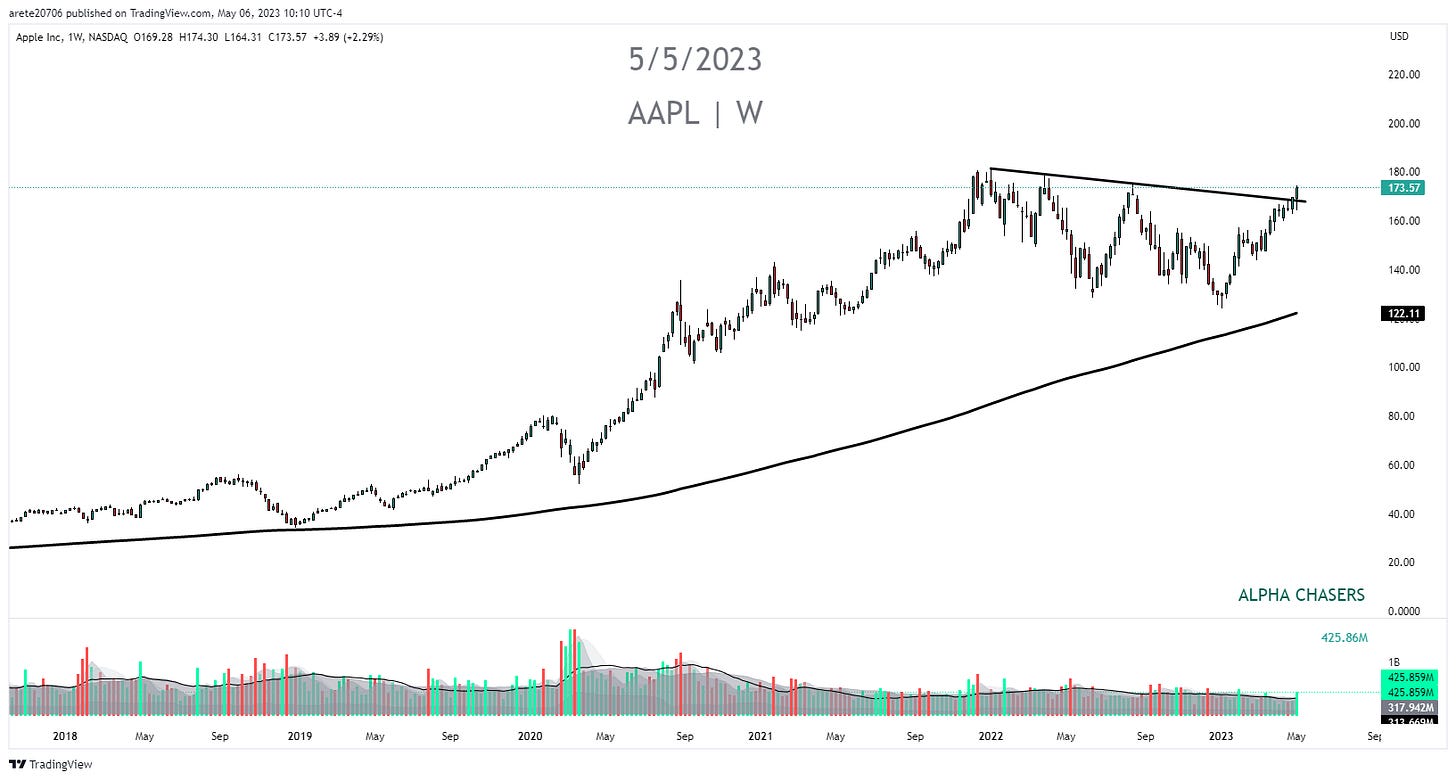
What a week! We had the testing of major support levels in key sectors , possibly the last fed rate hike , lost another regional bank and had AAPL breakout of a major trend. The financial sector(XLF) is currently teetering on support with the largest names JPM and GS showing weakness. At the same time the regional bank(KRE) index made new lows with testing the pandemic low. Fed Powell began his speech on Wednesday with prepared remarks about how sound and resilient the banking system is. We lost another bank in 90 minutes after their rate hike and speech. Pacific West (PACW) stated they are having significant issues and looking for a suitor. As we know the chances of a suitor are slim when all acquiring banks need to do is wait for the bank to become insolvent. The FDIC will insure the assets and then the frenzy begins as the assets are now backed by the FDIC. We saw this with FCNCA and NYCB which jumped massively on their acquisitions of assets. AAPL earnings did not disappoint as iPhone sales were greater than expected. The $170 level has been resistance.
SP500 4200 continues to be resistance
Nasdaq closing right on major resistance of 13,300
Russell 2000 struggling with the 200 SMA on the weekly chart and forming a bear flag.
Regional Banks (KRE) broke to multi year lows and is testing pandemic levels. Important to note IWM is 15.9% regional banks or related to regional banks.
Financial Sector (XLF) is still above the major support but starting to roll
The banking sector (KBE) which is weighted with such names as JPM and C is starting to look more like regional banks.
JPM unable to rally through resistance of $143
While regional banks that were allowed to buy assets are back to levels from before the crisis. NYCB
AAPL closed above a downward trend line which started on December 2021 on its earnings beat. Now 4% off all time highs
MSFT is 10% off its highs based upon a large earnings beat and its exposure to AI.
The technology sector (XLK) teeters right on major resistance. 45% of the sector is AAPL and MSFT.
NVDA breaking out of a massive weekly flag(blue) right into resistance.
AMD still having issues with the weekly DTL despite a positive collaboration with MSFT in the AI space.
Semiconductor index (SOXX) riding the lower trendline and staying above the all time high anchored VWAP
NYSE margin debt is starting to accelerate for the first time in two years
Nasdaq small speculators (hedge funds and HNW traders) are the shortest in 15 years. This is usually a contrarian indicator.
Defensive names are outperforming cyclicals (per GS)
Domestic stocks (U.S.) are underperforming Global stocks( per GS)
What happens after the last Fed Rate Hike (per Barclays)
Net deposits at commercial banks vs money markets
For a more in depth analysis of what happened and what to look for next week. Watch the video below. Pay close attention to what is said about IEP.
Wishing Everyone Massive Success!


