📈What Happened To Stocks in 20 Charts.
The past week we had some of the most important economic data releases of 2023. Consumer price index (CPI) is a measure of the average change over time in the prices paid by urban consumers for a market basket of consumer goods and services. The CPI Year over Year estimate of 5.0% was higher than the actual of 4.9%. The chances of a CPI beat were 21%. This is why the market responded with a massive push after the release that ended in the Nasdaq closing at new 2023 highs. Producers Price Index (PPI) solidified that inflation is coming down. The Producer Price Index (PPI) program measures the average change over time in the selling prices received by domestic producers for their output. The actual reading was 2.3% versus 2.4% Year over Year. The significance of the CPI and PPI data can not be overstated. We would have to go back to mid 2021 to find readings this low. This created quite a shift in rate hike expectations.
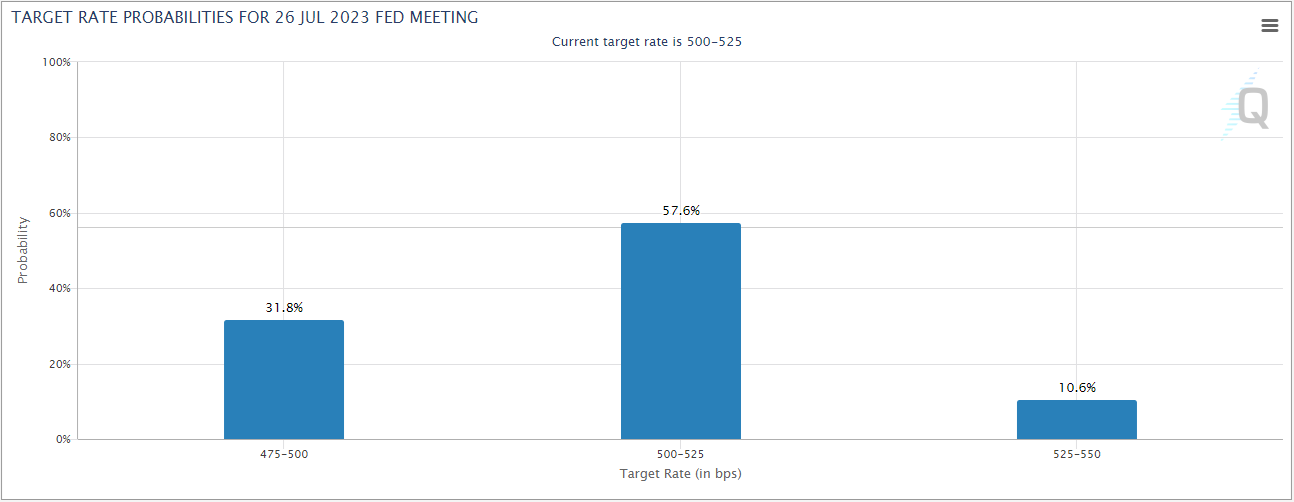
The Fed meeting expectations for June are now at 82.8% chance of a pause. What is interesting is how the next couple meetings are predicting Fed actions. July is now predicting a 31.8% chance of a rate cut.
The September meeting only has a 28.9% chance of rates staying where they are. The chances of a rate cut are at the September meeting are now at a 66.9% chance. This is a huge swing in a week.
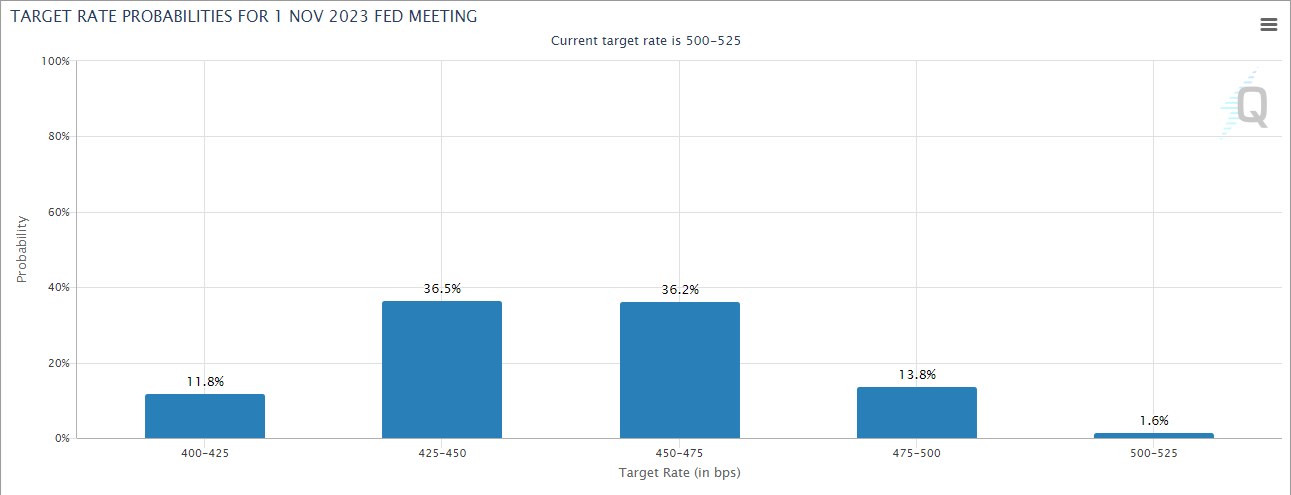
The November Fed meeting has a 1.6% chance of rates staying where they are right now with a 73% chance of at least two rate cuts.
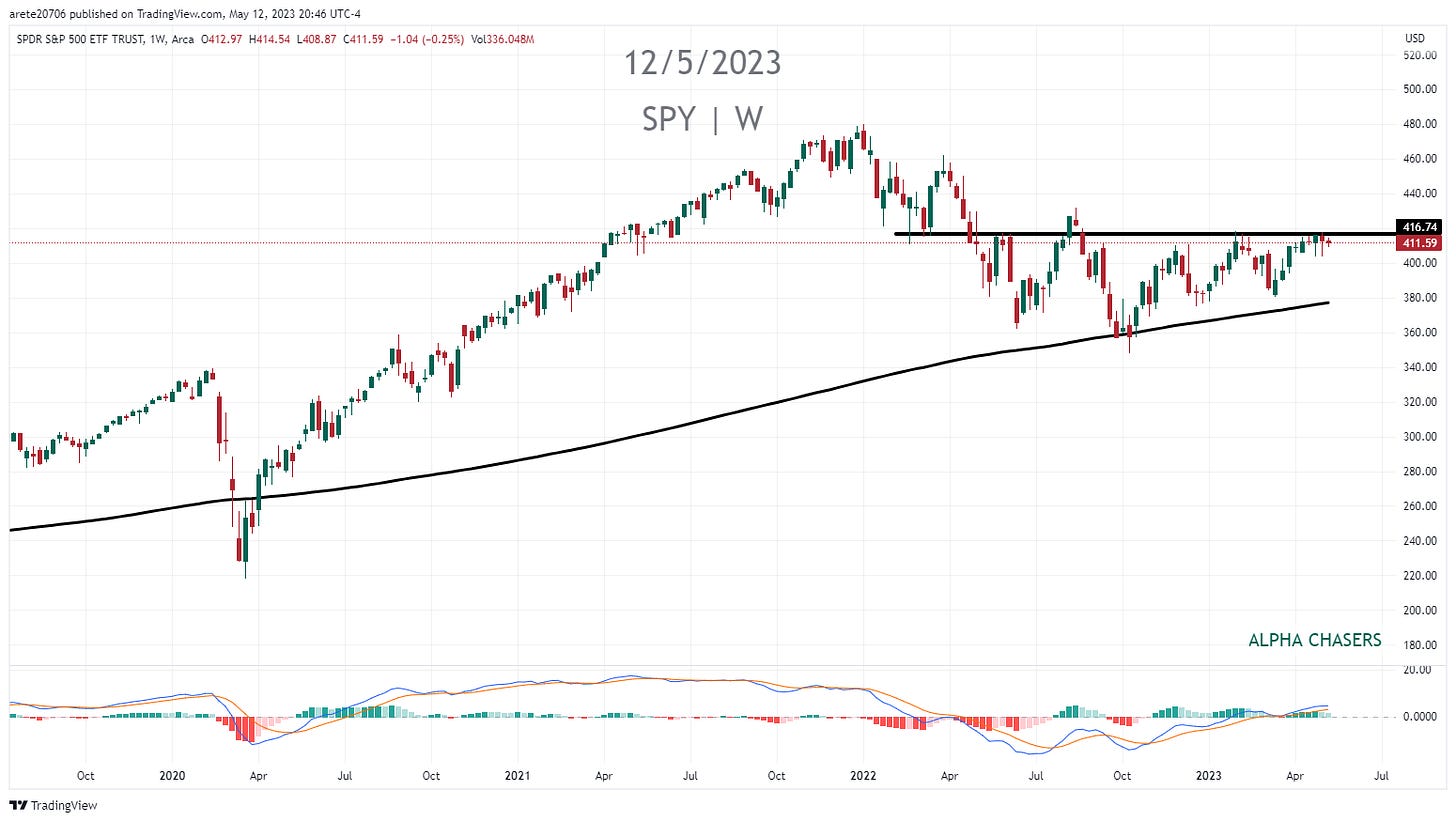
SP500 weekly continues to eat up supply right at the resistance band. The MACD is still above the zero line and rising which is bullish.
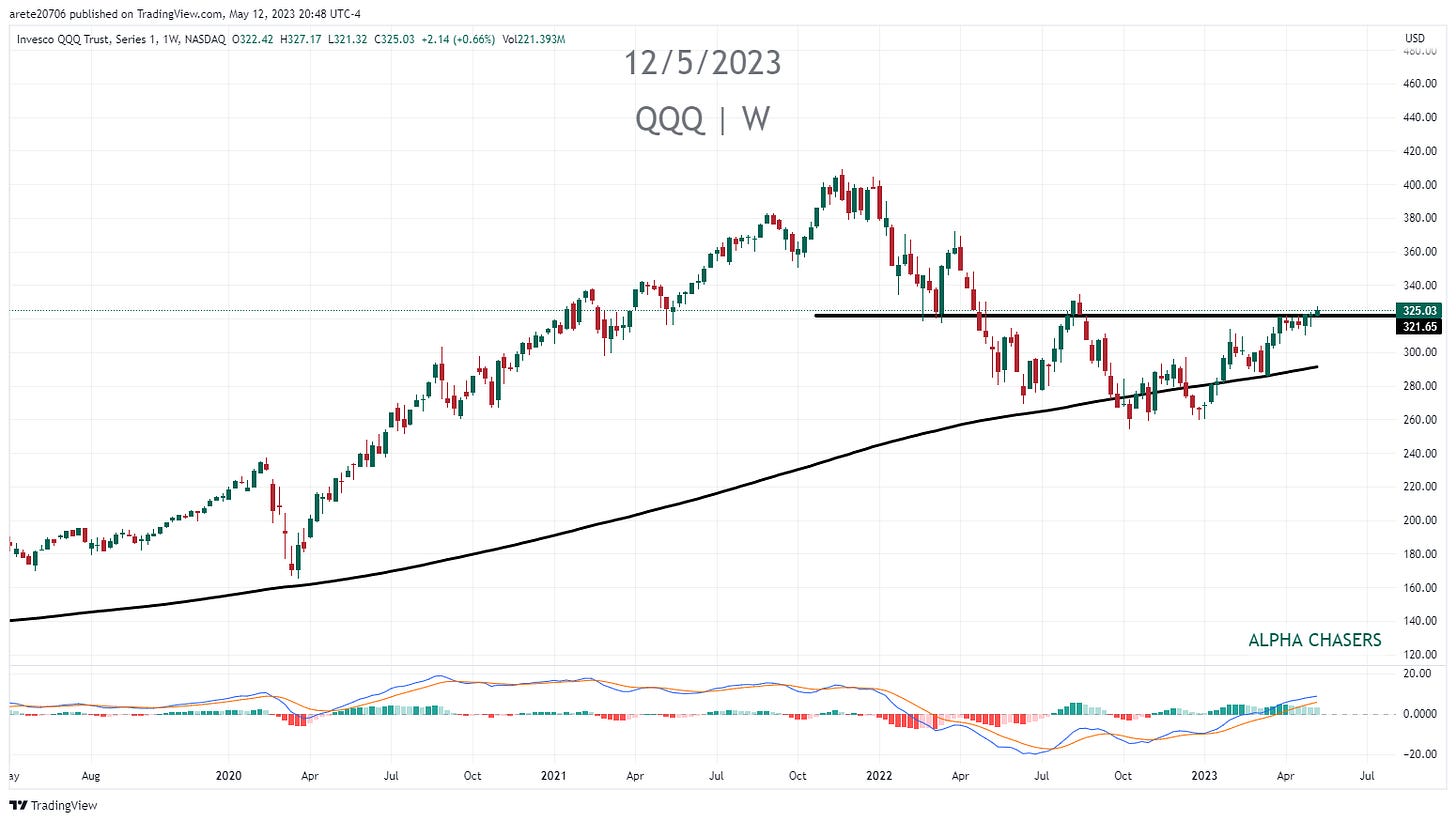
Nasdaq weekly pushed through resistance and closed at a new 9 month high as well as new 2023 high. MACD continues to be bullish.
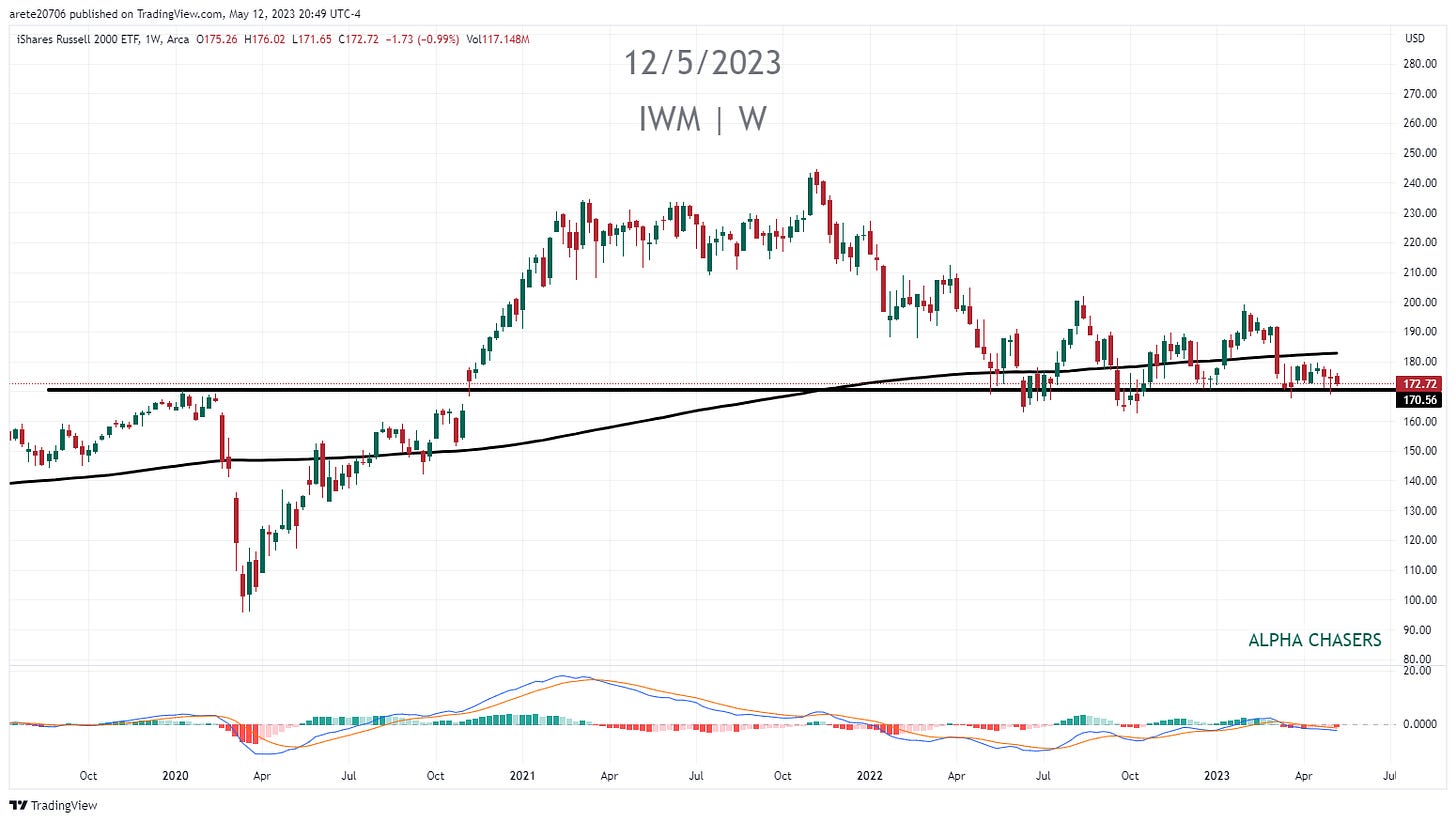
Russell 2000 continues to be the weakest of the indexes due to its 15.9% weighting of small financial companies which are currently under selling pressure. We are below the 200 SMA and the MACD is below zero. Both long term signals are bearish.
Small cap growth names(IWO) compared to small cap value names(IWN) is currently at a 52 week high and has room to continue to push
Overall growth (VUG) continues to outperform value (VTV) on a regular basis despite the market cap. Growth is actually setting up to push.
Copper is rolling over. Most traders use copper as a precursor to the SP500. The issue is the correlation changes greatly when inflation is coming down. A drop in inflation causes commodity prices to drop. Worth watching but I do not heavily weight this correlation.
Semiconductors continue to stay in this maddening wedge. Neither breaking down nor breaking out. As long as RSI above 50 I have a bullish bias.
NVDA is the largest weighting in SMH and continues to struggle with $290. The good news is the the stock continues to eat up supply at that level without much retreat. That said its still not over $290
AMD earnings were ok but the performance came after they said the magical letters AI three times and clicked their heels. Resistance continues to be $99 range
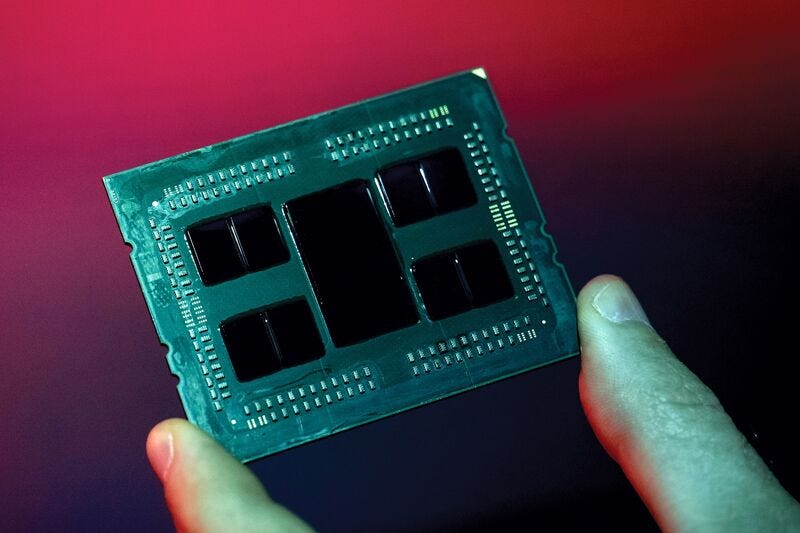
On a serious note MSFT partnered with AMD to expand their AI processors. Below are excerpts from the recent Bloomberg article.
Microsoft Working With AMD on Expansion Into AI Processors
Software maker will help boost AMD’s supply of in-demand parts
Companies need AI processing power amid ChatGPT-fueled boom
By
Dina Bass and Ian King
May 4, 2023 at 1:19 PM
Microsoft Corp. is working with Advanced Micro Devices Inc. on the chipmaker’s expansion into artificial intelligence processors, according to people with knowledge of the situation, part of a multipronged strategy to secure more of the highly coveted components.
The companies are teaming up to offer an alternative to Nvidia Corp., which dominates the market for AI-capable chips called graphics processing units, said the people, who asked not to be identified because the matter is private. The software giant is providing support to bolster AMD’s efforts, including engineering resources, and working with the chipmaker on a homegrown Microsoft processor for AI workloads, code-named Athena, the people said.
MSFT at 52 weeks highs and getting ready to test the $315 resistance
AAPL released solid earnings and recently flipped the major downward trend line (DTL). We are 6% away from all time highs.
IEP weekly tested the $30 level again and held frustrating short sellers. Should the recent short seller Hindenburg report turn out to be hot air this may get interesting. This is the lowest RSI reading in 25 years.
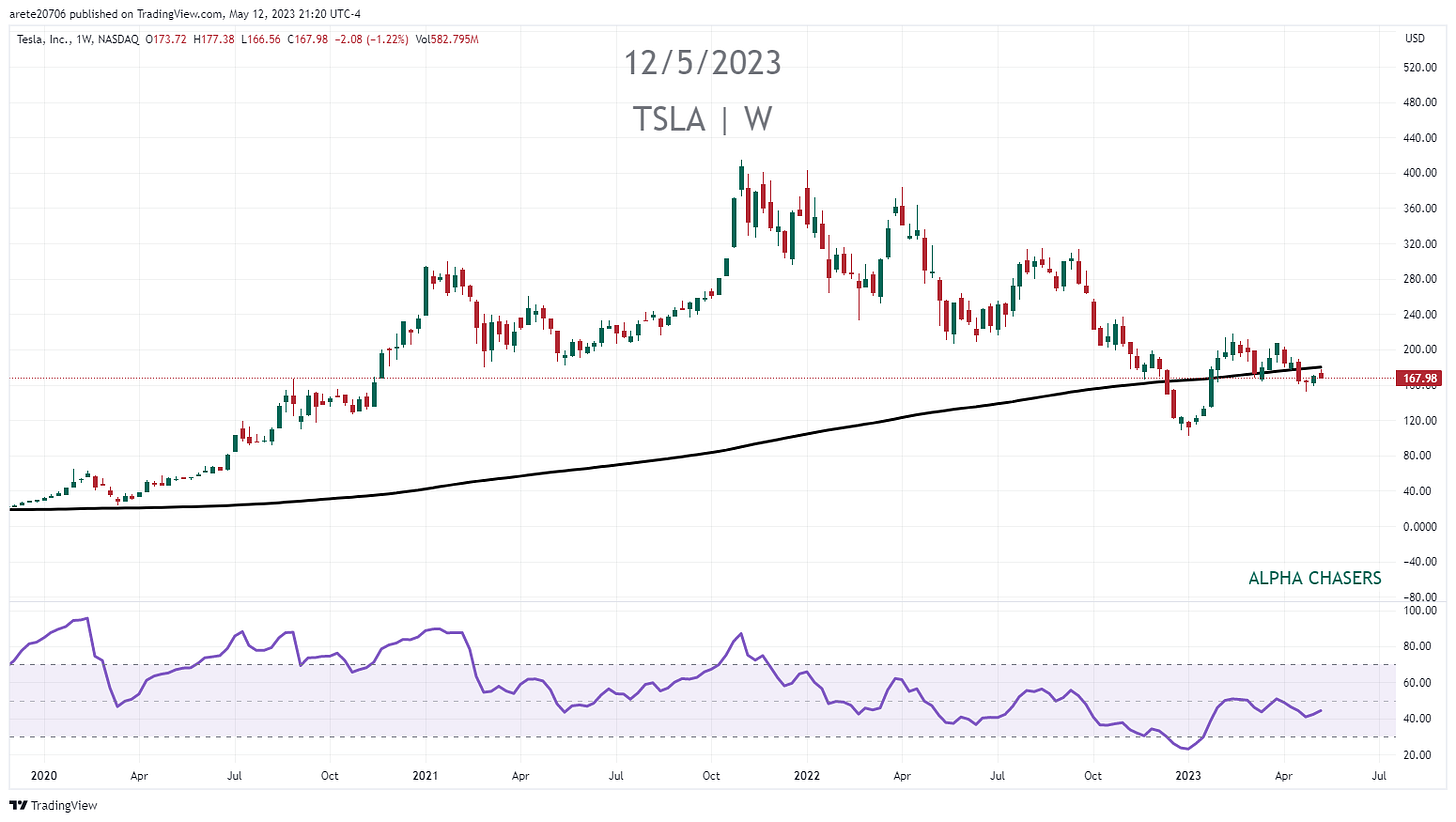
TSLA rally fizzled and now the stock is trapped under the 200 SMA and the RSI can not get over 50 on the weekly chart.
RACE at all time highs. We are seeing high end brand companies show tremendous strength
LVMHF near all time highs and forming a bull flag.
Regional banks close at a new multiyear low on the weekly chart. Despite assurances from several solid banks investors are pulling funds out of regional names. (KRE). We need to hold here or we are going to test the pandemic lows.
Watch this video for exact levels I am watching on leading stocks next week and what happened on Friday that has only happened 4 time in 50 years,
Wishing Everyone Massive Success!


