📈 What Happened With CPI?
CPI Release
Yesterday CPI was released and we had a wild day in the market to say the least.
Here are the key numbers that were released:
Core Inflation Rate MoM: Actual: 0.3%; Consensus: 0.3%
Core Inflation Rate YoY: Actual: 3.9%; Consensus: 3.8%
Inflation Rate MoM: Actual: 0.3%; Consensus: 0.2%
Inflation Rate YoY: Actual: 3.4%; Consensus: 3.2%
30-Year Bond Auction: Actual: 4.229%; Consensus: 4.3444%
What Does it Mean?
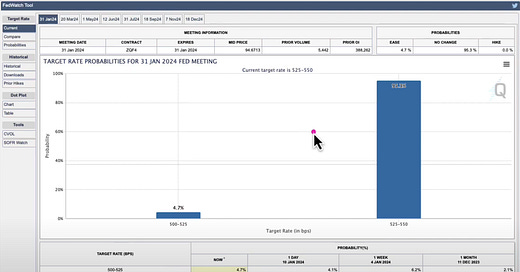
Based on the FedWatch tool, we had mixed results on CPI.
Initially, when data released, the updated percent chance of a rate cut in January dropped from 4.1% to 2.1%, but finished the day at 4.7%.
Therefore they actually slightly increased the probability of a rate cut in January.
CPI Trending
The chart below shows the one-month percent change in CPI for all urban consumers.
As you can see, while we are making headway versus most of 2023, CPI has increased for two consecutive months now which is something to watch out for.
In the below chart you can see the actual source of where the increase in CPI is coming from. This is helpful information for choosing stocks/sectors that are not seeing inflation.
A couple takeaways to note:
Fuel oil is down almost 15%
Shelter is up significantly
Food is up as well
The stock market was relatively undecided on how to react to this news. We sold off early and recovered later in the day.
The next few days will be important to understand the trend of the market.
For more information on CPI, watch the clip below:


