The Market
We had a volatile week this week with CPI data releasing and the semiconductor craze (notably SMCI) coming back down to Earth on Friday.
Here’s a look at the indexes that will help you trade next week.
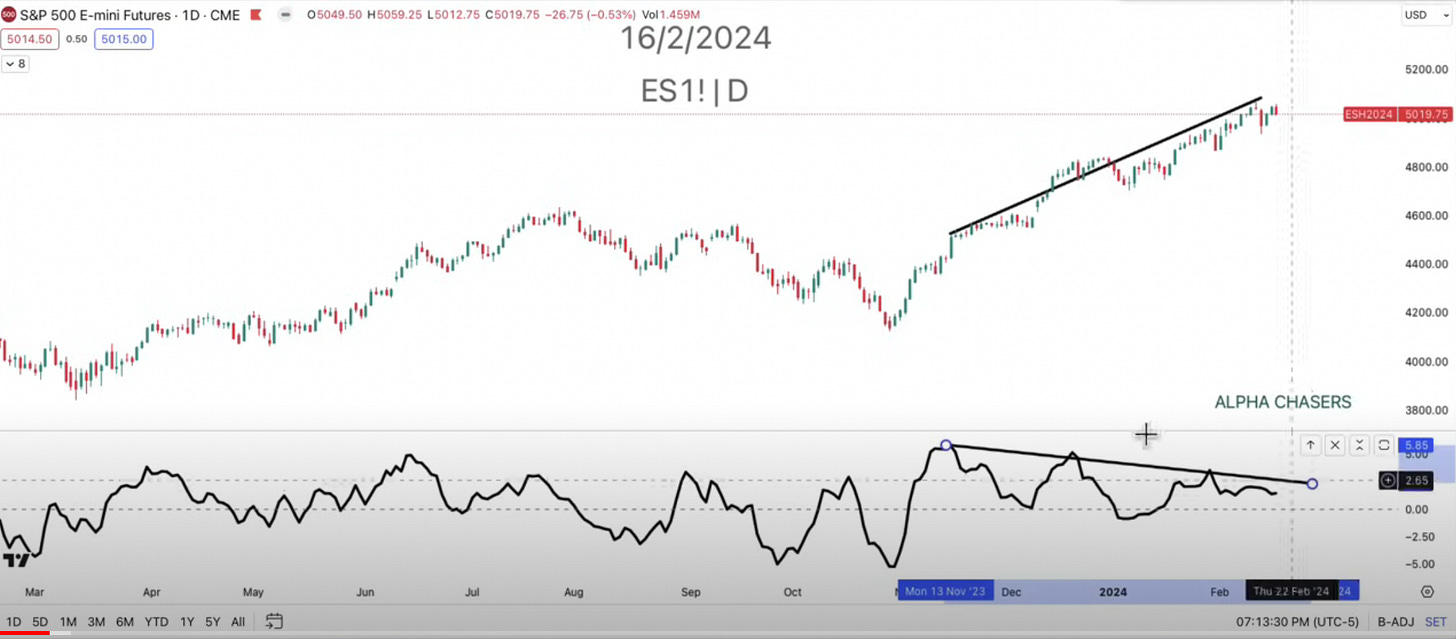
S&P 500
The most glaring sign with the S&P 500 is that the RSI is showing a negative divergence. You can see below that as the market is moving higher our RSI is making lower highs.
This does not mean that the market is going lower, but it is definitely important to keep an eye on.
Nasdaq
Similarly, you can see that we are at a pivotal level on RSI for the Nasdaq. We continue to respect the RSI level marked off below which can potentially be a signal of a short term top.
We also have a near bearish engulfing candle on the weekly that can also be a signal of a short term top.
Russell 2000
The Russell is really starting to shape up. You can see that we have been trading in a range for over a year, but over the last few weeks we are seeing that we are not breaking down to our support and are starting to build towards breaking out of that base.
This sector looks the most primed for a short term move higher of the three - so keep an eye on small caps.
Relative Strength
Finally we can see by comparing the sectors that on Friday we saw massive relative strength in the IWM (Russell 2000) vs. the other indexes.
This confirms where money has been flowing and where we should be paying attention.
I dive deeper into the indexes and stocks to watch in the video below:


I note that RTY made a false breakout in Nov/21 after trading in a range for 9 months.
Maybe inflation was starting to come onto the radar then that might account for the reversal, but it also seems that we might be wise not to ignore deteriorating economic fundamentals right now. Once bitten, twice shy.