Where is the Market Going?
Let’s walk through a few indicators that I’ve been keeping an eye on that I think are pertinent to understand going forward, especially after the huge week of economic data that we had this past week.
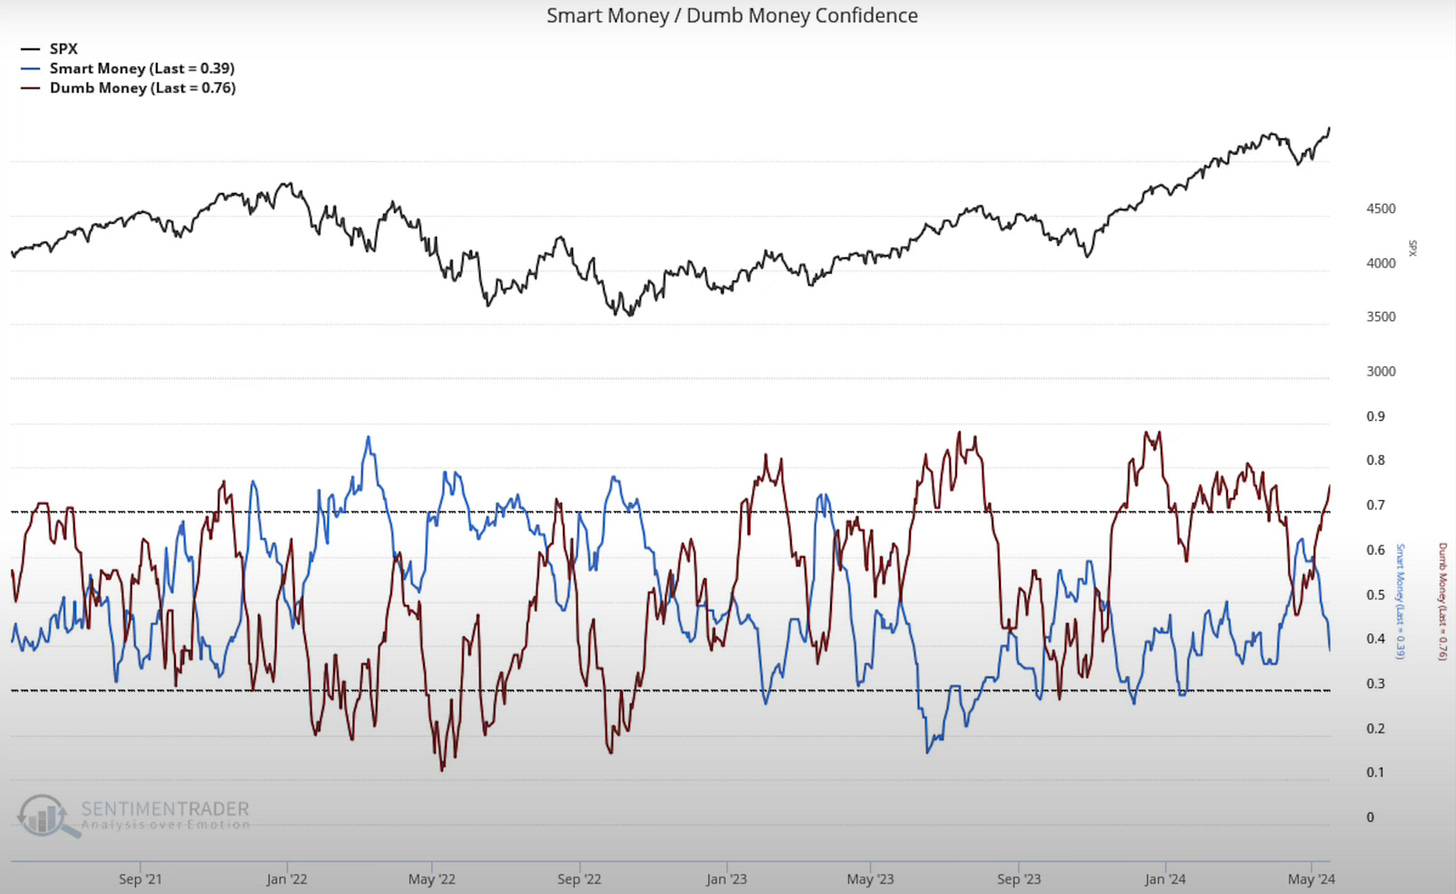
Smart Money vs. Dumb Money
I share this chart often but I think it is important to understand what is happening right now.
You can see that we just had a shift where dumb money (retail) crossed smart money (institutions).
If you look at prior instances of this cross, it signals a move to the upside most of the time. This is a good sign for the market.
However you need to watch that 0.7 level on retail. Often when retail breaks below that level, the market begins to sell off. So overall this is a good sign but it’s something to keep an eye on. I will continue showing this chart to update on progress in future posts/YouTube videos.
NYSE Margin Debt % Growth
This chart shows the 12-month rate of change percentage in margin debt growth among US investors.
What I look for here is whether we are leveraging or deleveraging. The market will go down when we are deleveraging and vice versa.
The more money that you have on margin, the more volatility you will see in the market. I expect this to continue, and this is important for you to understand how you should be trading the market going forward.
While I believe we are going higher, you are going to see increasing volatility, so you will need to adjust your trading strategy to reflect this.
I dive into additional indicators in the video below and share the names I am looking to trade next week:


